|
|
|||||
|
Using
Soil Erosion Modeling for Improved Conservation Planning: |
|||||
|
|
|||||
|
Using
Soil Erosion Modeling for Improved Conservation Planning: |
|||||
| Land Use legend |
C Factor %agriculture (row crops) legend |
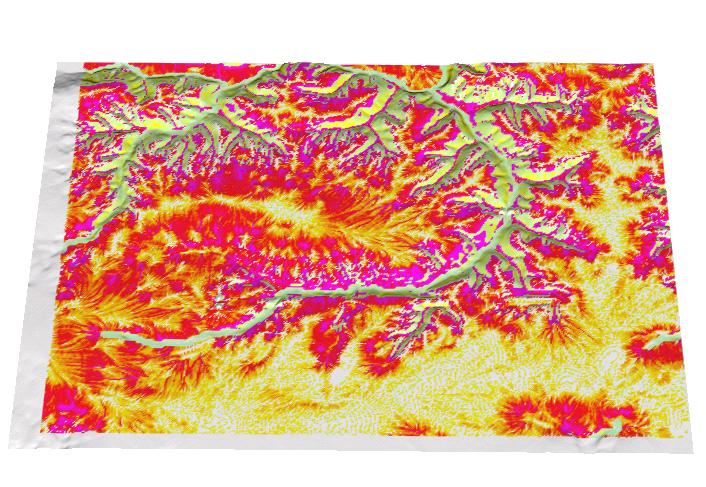
Soil Detachment: total [1000t] average[t/ay] legend |
Soil Erosion/Deposition: excess[1000t/ay] legend | Comments |
|---|---|---|---|---|
| bare | N/A |
10,500 / 62 |
77 |
X |
| corn | 100 |
5,200 / 31 |
38  |
X |
| 60 ft stream buffer | 96 |
4,800 / 28
|
19 |
only big streams have buffers |
| 100 ft stream buffer | 94 |
4,600 / 27 |
19 |
only big streams have buffers |
| 60ft stream buffer, forest on slopes > 10% | 81 |
2,000 / 12

|
15 |
X |
| current | 63 |
1,300 / 8
 |
4 |
grains on steep slopes add to erosion - possible error in LU? |
| model-based, forest/dense grass where A>10 | 58 |
200 / 1.2
|
0.1
|
almost the same % of agriculture as current, but some are in too small patches |
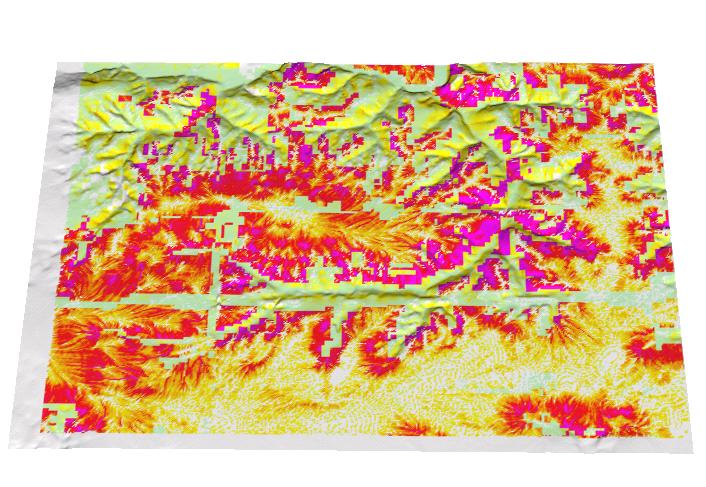
Computed with GRASS5 under LINUX using modified USLE3D and USPED models, and data from USGS and ILGIS.
Comments - the results of the modeling effort indicate that:
1. This area has a very good, conservation oriented land use pattern
(e.g. compare current land use with "buffers only" scenario).
2. Soil loss can be further reduced by focusing on headwater areas and
areas with concentrated flow (possible gullies, intermittent streams)
3. Rules for conservation areas that include prescription for both distance from stream
and slope steepness are good, however they miss headwaters and concentrated
flow.
4. Stream buffers based only on a distance from larger streams do not provide
sufficient protection - terrain configuration has to be considered.
5. Erosion/deposition modeling (USPED) shows significant deposition in valleys
and hollows (more than what is usually observed from the model). High erosion typical for gullies starts
to show up in the center of depositional areas only after increasing
resolution to 5m and smoothing, which means that at this resolution
the erosion from concentrated flow is underestimated and a higher resolution is needed
to capture it. Our previous experience suggests 2-3m resolution is sufficient.
6. Modeling the spatial distribution of soil detachment and net erosion/deposition
can provide valuable information for science-based extension/enhancement
of conservation program rules, particularly if it is coupled with the appropriate field
observations.
|
|


