|
|
|||||
|
Using
Soil Erosion Modeling for Improved Conservation Planning: |
|||||
|
|
|||||
|
Using
Soil Erosion Modeling for Improved Conservation Planning: |
|||||
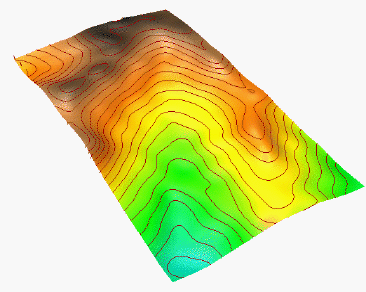
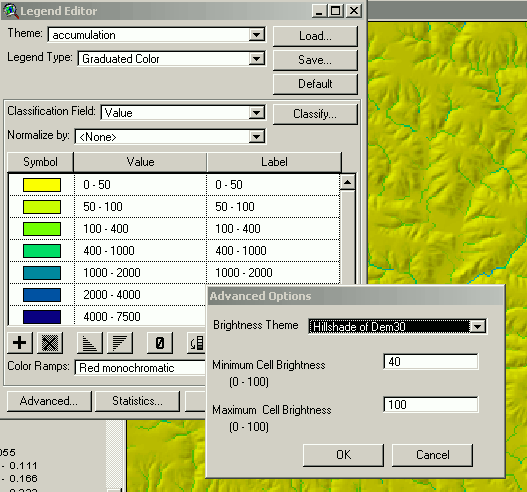
Elevation and its derived parameters, water flow, net erosion and deposition are in general continuous phenomena - meaning the values change from point to point. Mathematically they are represented as multivariate functions (in our case, bi-variate) z=f(x,y) or q=g(x,y). In GIS such phenomena are discretized, typically using a grid (raster) representation where each grid cell represents a point in the landscape. Graphically, such phenomena can be represented by isolines and/or a color gradient.
 |
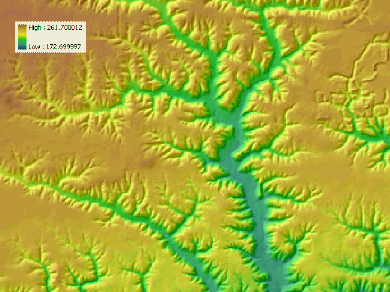 |
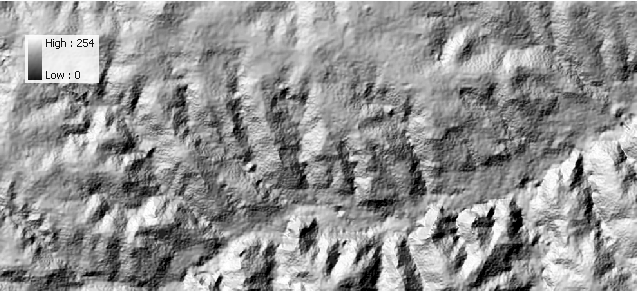
| Elevation represented with isolines (and color gradient). | Elevation represented with a color gradient. |
Phenomena with linear isoline interval and color table (elevation, slope)
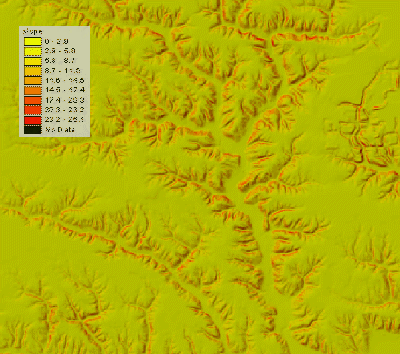 |
Phenomena with non-linear isoline interval and color table (water
flow, detachment rate, sediment flow, net erosion/deposition)
|
 |
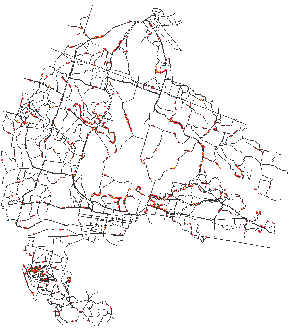
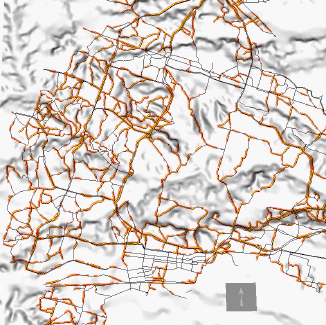
Adding additional relevant information (streams, roads and other man-made features..., shaded topography)
  |
|
 |
|
 |
|
|


