|
|
|||||
|
Using
Soil Erosion Modeling for Improved Conservation Planning: |
|||||
|
|
|||||
|
Using
Soil Erosion Modeling for Improved Conservation Planning: |
|||||
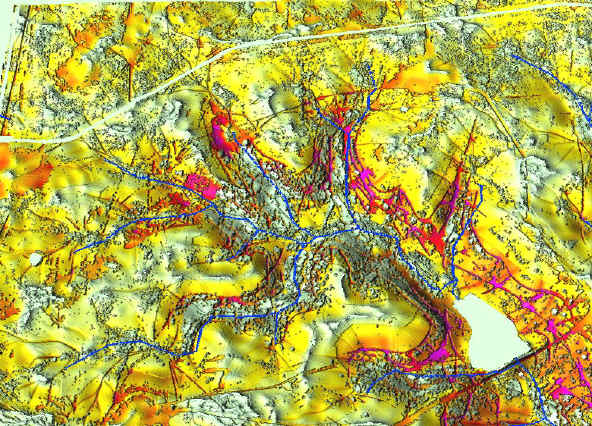
Flows of water, soil, and other elements in the landscape are to a large extent
controlled or influenced by topography. Displaying the input parameters
and results of erosion modeling as color maps draped over 3D views of topography
is extremely useful for understanding the spatial patterns.
3D views of topography do not replace an accurate 2D map, but they are most useful
in interactive mode for visual analysis of complex spatial relations and details.
As static images, they can be used to stress certain phenomena that may be difficult
to capture by 2D maps.
Properties of 3D views:
(We mention only basic properties here, please refer to manuals
accompanying GIS software
for a full explanation of all viewing parameters (NVIZ, ArcView 3D Analyst,
etc.)).
| Z-exaggeration. Especially for relatively flat terrain it is useful to interactively change the z-scale (usually be applying a multiplying factor) and view the terrain at different levels of vertical exaggeration to get a better "feeling" for the topography that we see and what topographic features may be hardly visible, but "pop-up" when exaggeration is used. These features can often explain spatial variability in vegetation or soil properties. An exaggerated z-scale is also crucial for analysis of possible artifacts in DEMs. In general, a z-scale multiplier between 2-3 (200-300% exaggeration) works well for elevation data. |  |
| Selection of perspective, height and direction of view. Choose a high, central elevation for the viewing position (position of the eye or "camera" within the coordinate space of the data) and use close-in (narrow angle of view) perspective to obtain a 3D image similar to a shaded 2D map, |  |
| A low viewing height is useful for analyzing details as the viewer position is closer to the data. |  |
| Lighting. A low elevation light source creates substantial shade on 3d data and is useful for revealing subtle features and artifacts. If an erosion/deposition map is draped over terrain, however, the darker shading may obscure the actual erosion/deposition pattern. | 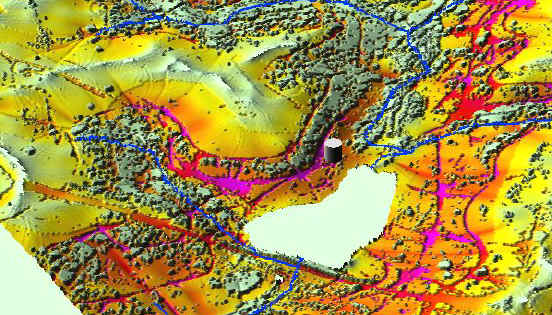 |
| A high elevation light source results in a subtler view of topography and better preserves the colors of the draped map. Light intensity (brightness) can be adjusted also. |  |
| Interactive Viewing. 3d displays can also support interactive viewing and query, allowing the viewer to move the viewer location or the data position (rotation, etc) to obtain desired view of the data. This is important in 3d displays because of perspective distortion and line of sight obscuring by data features. Rendering times vary greatly depending on the size of the data set, type of hardware, and software. | 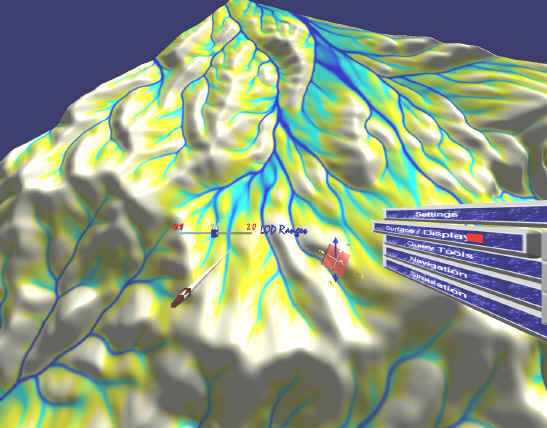 |
| Animations and "fly- throughs." Most 3D terrain viewing supports fly throughs of the data set. It is useful for viewing large data sets and searching for selected details. For example the path can be set to fly-through the terrain with a draped runoff or erosion/deposition map to help explore the topographic effects. | 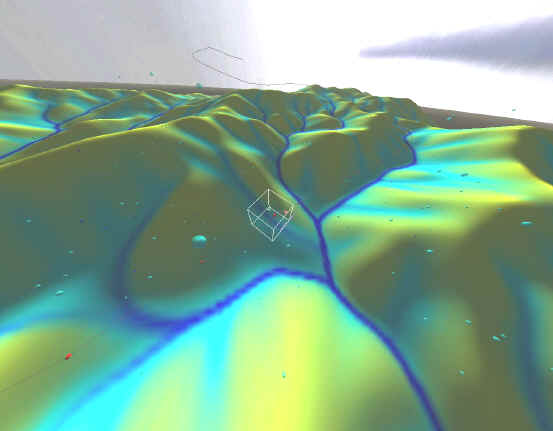 |
Representing water and sediment flow as a surface
By itself, color has limited capabilities to communicate large
ranges in values (in part from the difficulty of the eye to distinguish many
colors simultaneously), for example, non-linear values obtained from
computing concentrated flow. To reveal this phenomenon, or view and analyze where
discontinuities or rapid changes occur (such as the initiation of concentrated
flow), it is useful to view the flow data as a surface with appropriate surface
exaggeration:
| Water flow |  |
| Sediment flow |  |
It is possible to combine the two approaches and "drape" the flow
surface over the terrain surface. This allows communication of the relation
between topography and flow, while stressing the sharp increase
in flow rates due to concentrated flow within valleys
| Water flow over terrain | 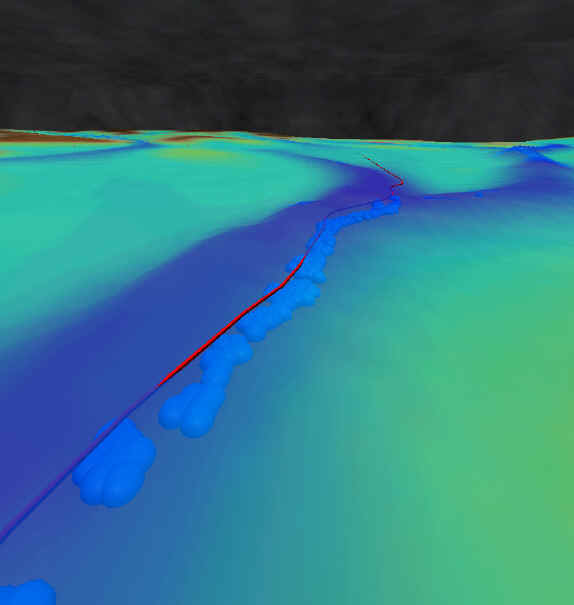 |
| Sediment flow over terrain | 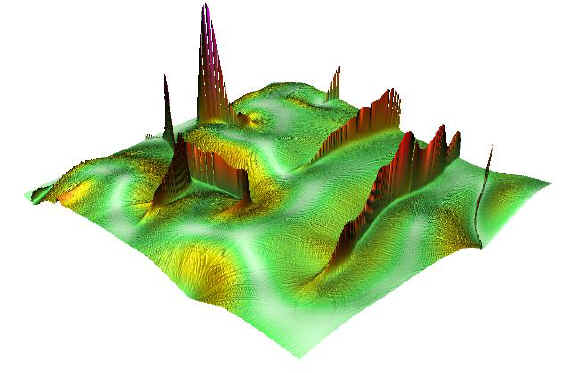 |
| Sediment flow over terrain with erosion/deposition draped as color. |  |
Tips and tricks
| Eroded terrain
can be used to stress the impact of erosion
(especially if it affects linear features
such as roads). It can be created by subtracting a logarithm of the erosion rate
from the elevation surface and display the resulting surface with erosion
map used for color.
r.mapcalc "eleveroded=elevation-log(rusle3d)" |
 |
|
|


