|
|
|||||
|
Using
Soil Erosion Modeling for Improved Conservation Planning: |
|||||


Analyzing and communicating the modeling results
Creating maps representing the inputs/outputs as classes
|
|
|||||
|
Using
Soil Erosion Modeling for Improved Conservation Planning: |
|||||
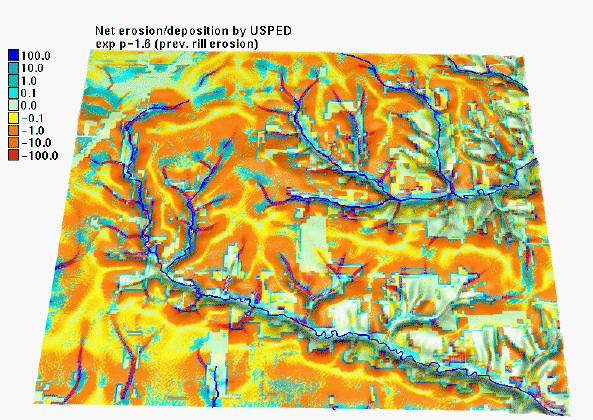
| The use of modeling outputs for management often requires dividing the managed landscape into subareas with different priorities according to their characteristics. Different management approaches are then used for these different subareas. To create such subareas the continuous maps, representing water and sediment flow as well as erosion and deposition, can be divided into discrete classes. | 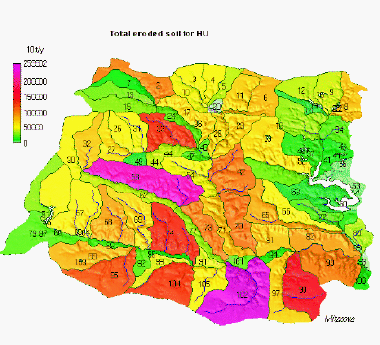 |
Compare the continuous and discrete class map for erosion and deposition.
 |
|
When phenomena have a non-linear distribution, the intervals defining classes should follow similar rules as the intervals for creating the continuous color table. In this case, however, both the color table and underlying map uses the intervals. Classes represent a range of values and are labeled accordingly.
These are suggested classes and maps for:
| steady state water flow
|
 |
| detachment | 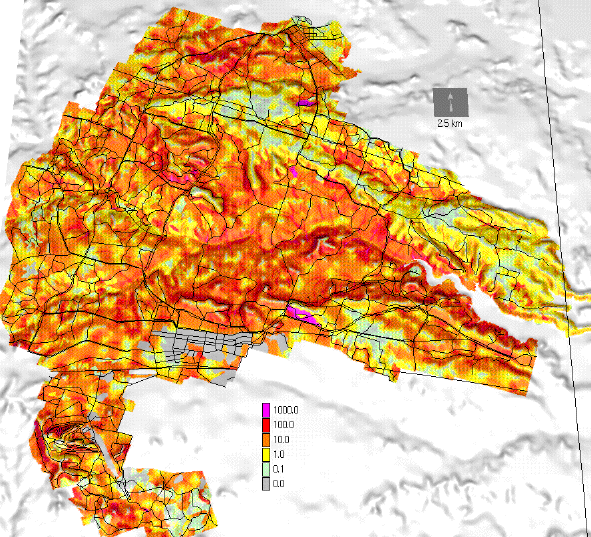 |
net erosion/deposition |
 |
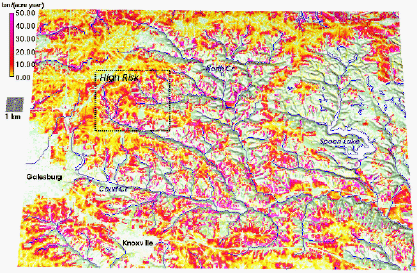
However, these maps can still have a content that is too "rich" for certain applications necessitating the creation of maps with even simpler content. A good examples is a map with just 2 categories: Hot Spots and other. A few examples of such maps include:
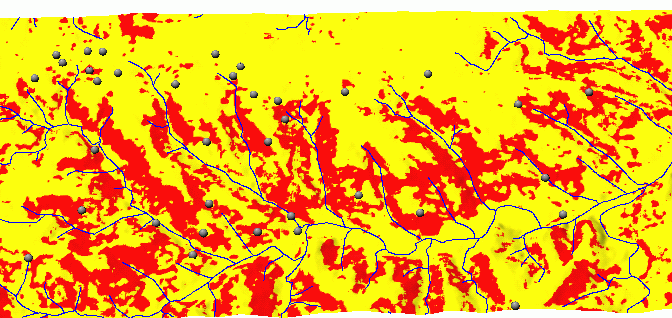
Critical Erosion "Hot Spots"
|
|
