Measuring the Evolution of Jockey's Ridge
Results
Contact
Helena Mitasova
at
hmitaso@unity.ncsu.edu
Jockey's Ridge is loosing its elevation, migrating S/SW and expanding
its area
(at its southern edge beyond the park and sand needs to be
trucked back into the park - see photos).
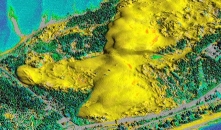
Data: 1974 and 1995: photogrammetry, 1999: USGS/NOAA ATM LIDAR and 2001: NC Flood mapping LIDAR
Year                 1950   1974   1995   1999   2001   2002  2004  2007  2008
------------------------------------------------------------------------------
peak elevation [m]    43     34     27    25.7   24.8   23.6  21.9   21    22
area z>6m [acre]      NA     96    109     NA   106     NA    NA
Space-Time Cube analysis Evolution of countours 15-26 with 1m step, time period 1974-2008 Change 2008 and 2007
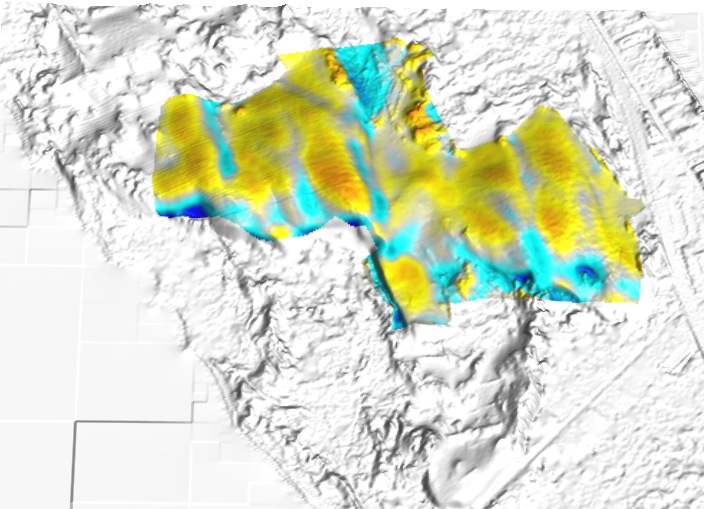
Elevation change: 2007-2001 bare earth, 2008-1999 incl. vegetation
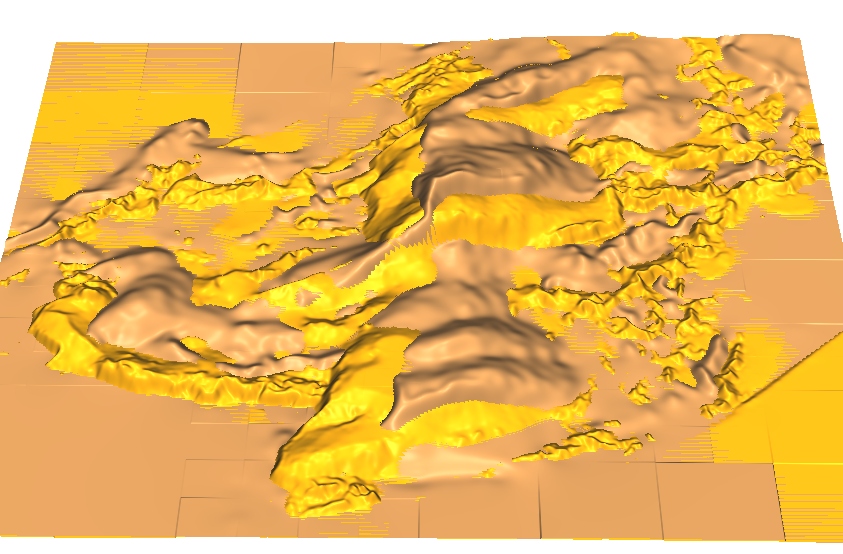
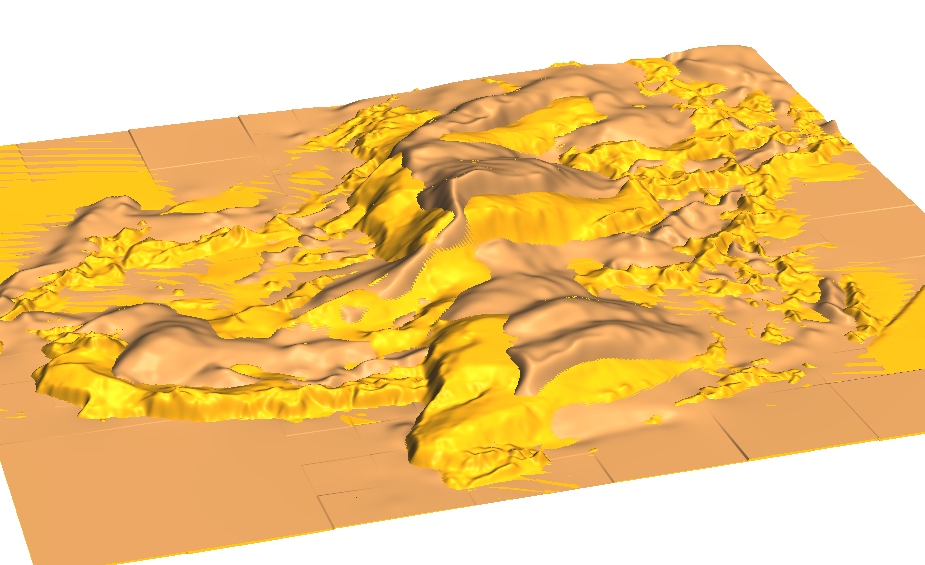
DEMs 1974-2008
Crests: 2001, 2007, 2008
Overlayed 1999(grey) and 2007(colored)
profile 1
profile 2
profile 3
profile 4
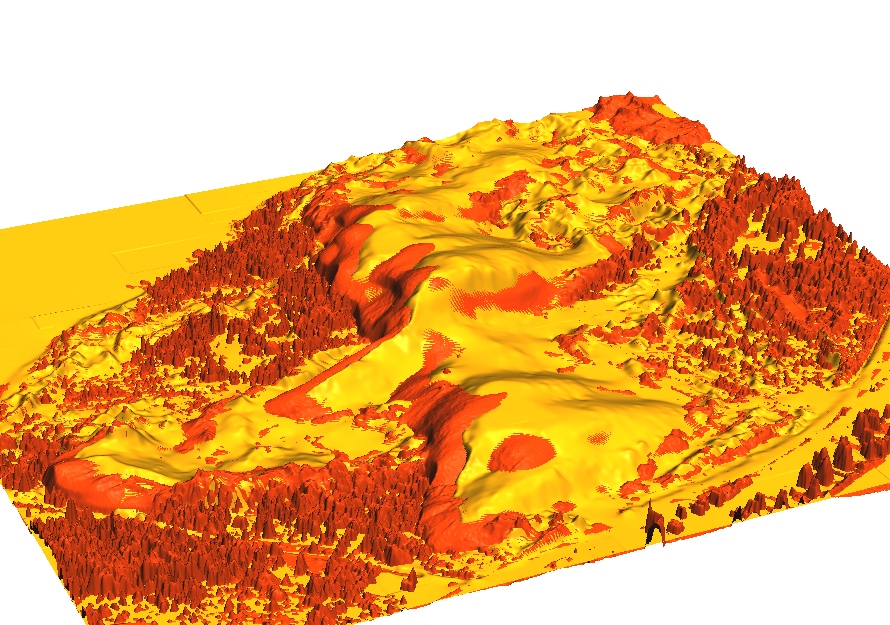
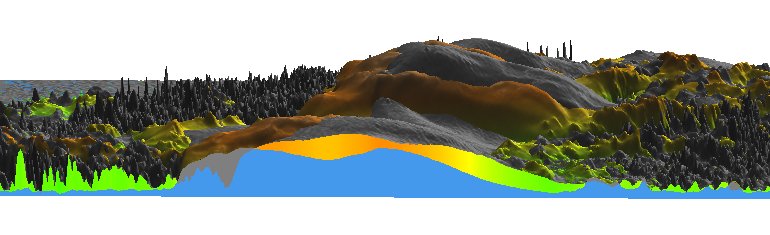
Overlayed elevation surfaces:
1974 (brown) and 1995 (orange):
 East view
 SE view
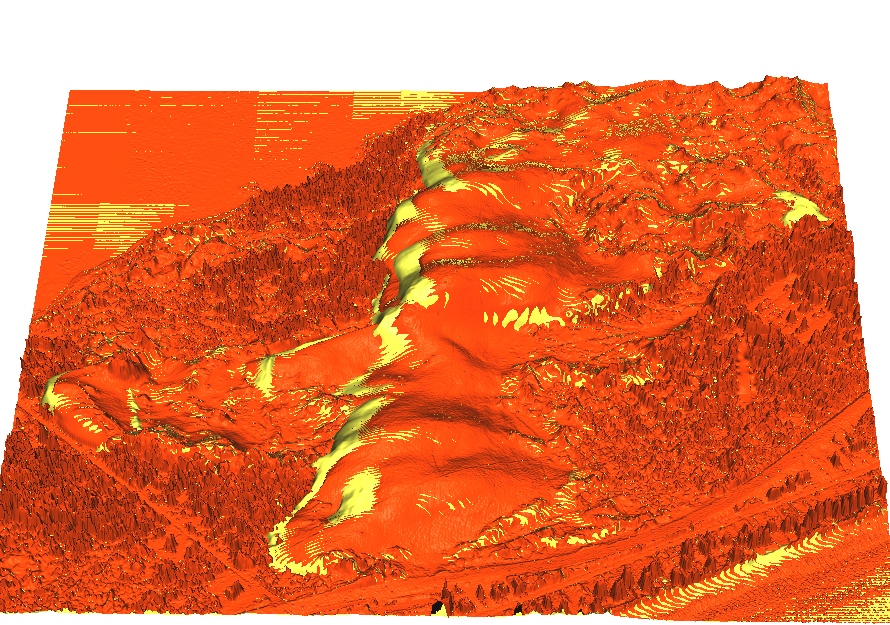
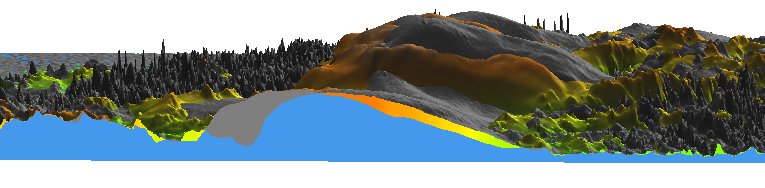
1995 (orange) and 1999 (red, with vegetation):
 East view
 SE view
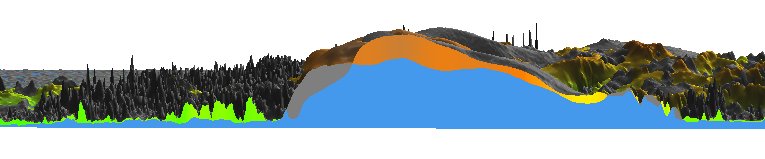
1999 (red) and 2001 (yellow):
 East view
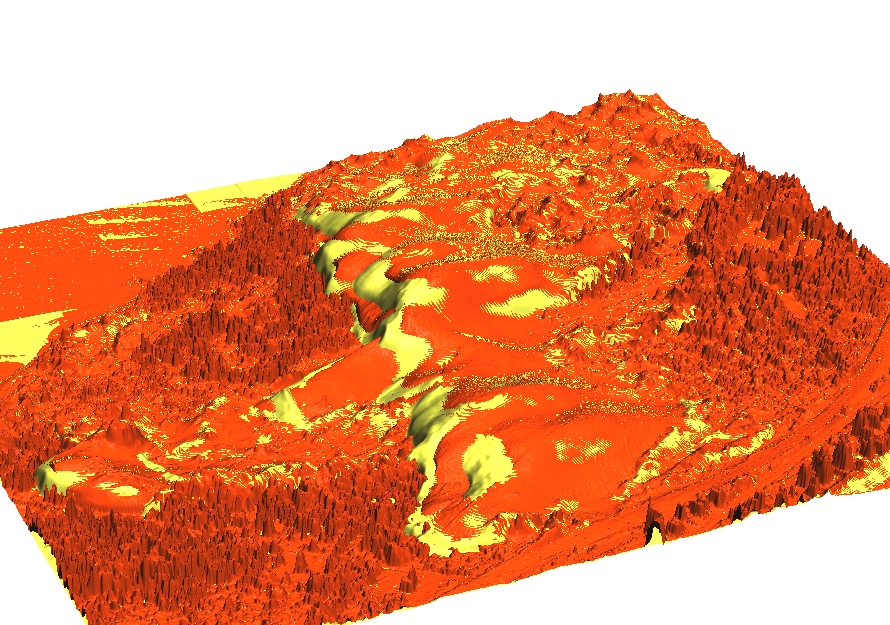 SE view
2001 (yellow) and 2004 (green):
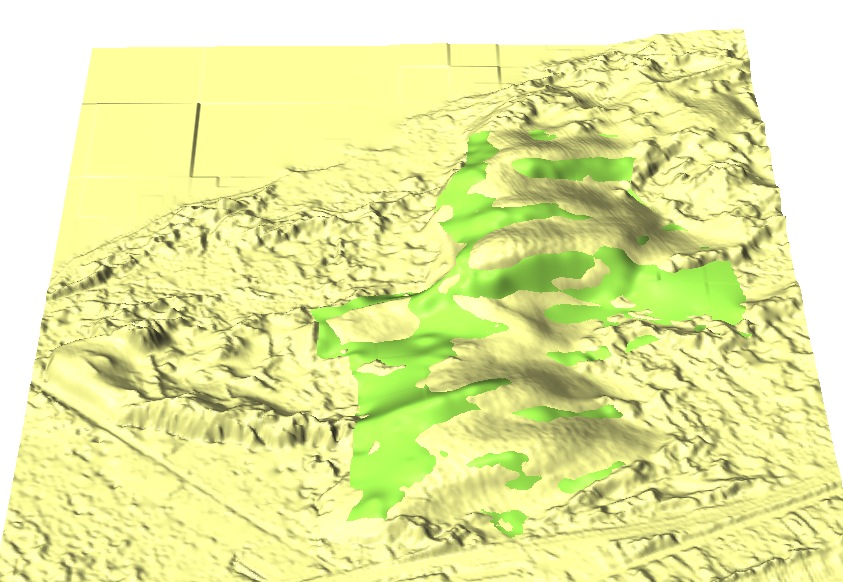 East view
 SE view
Time series of DEMs representing evolution of Jockey's Ridge sand dune 1974-2001:
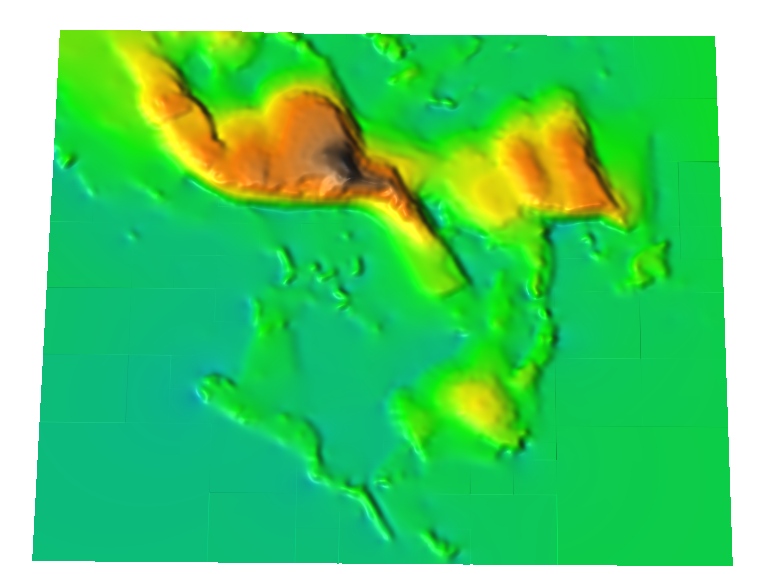 1974
1974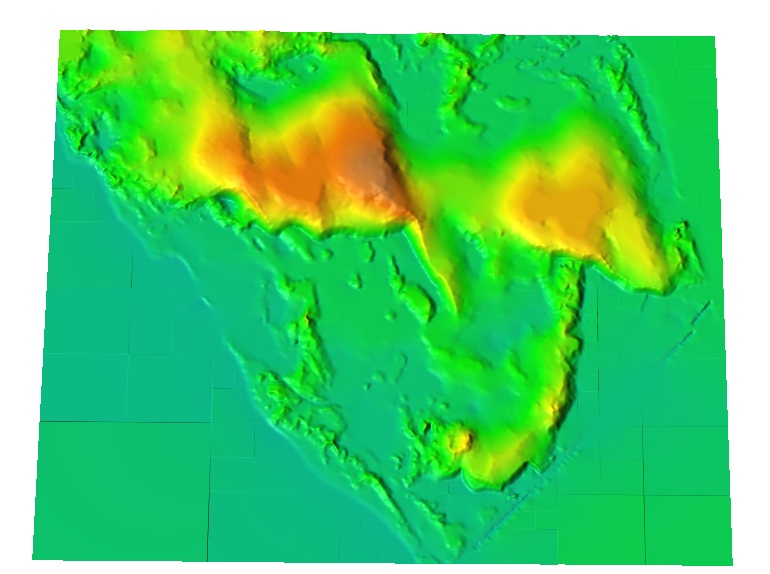 1995
1995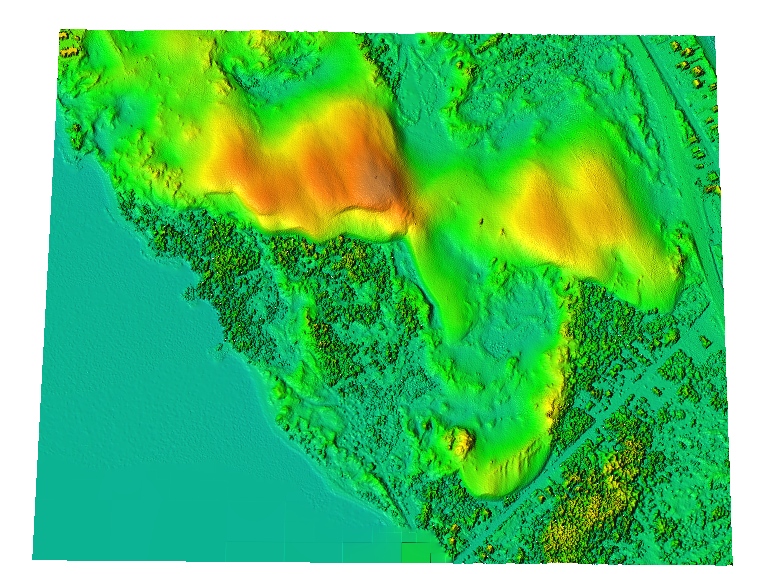 1999
1999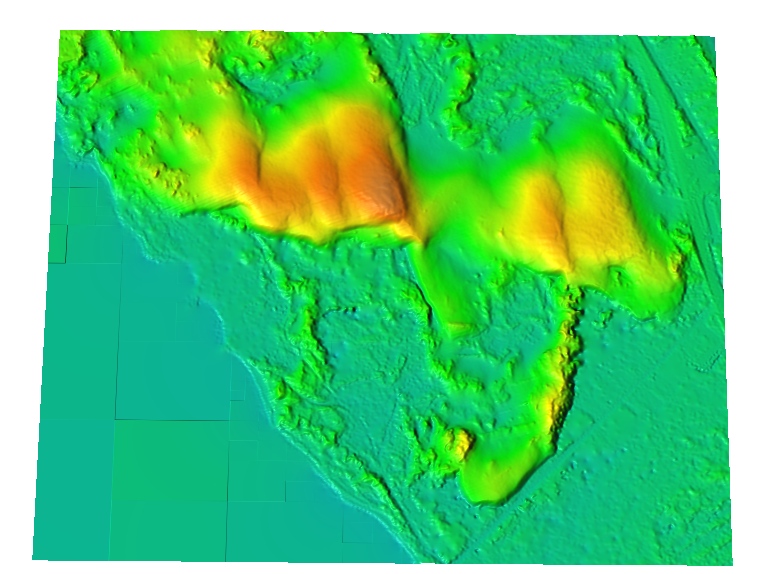 2001
2001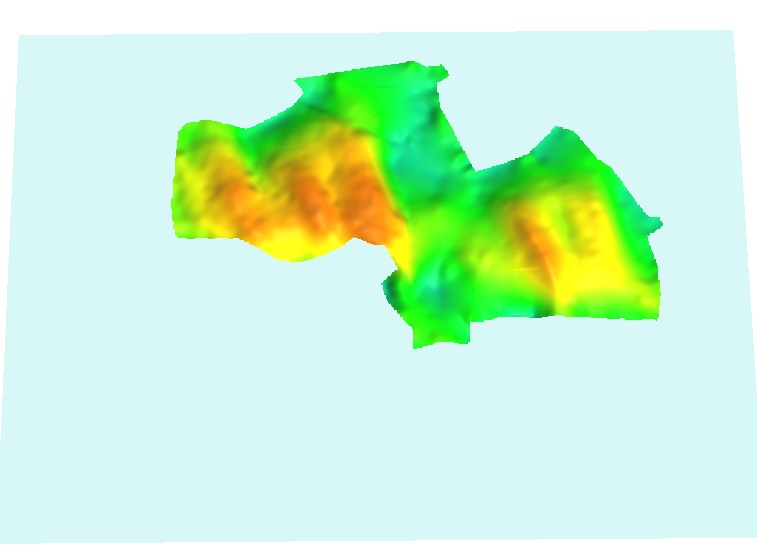 2004
2004
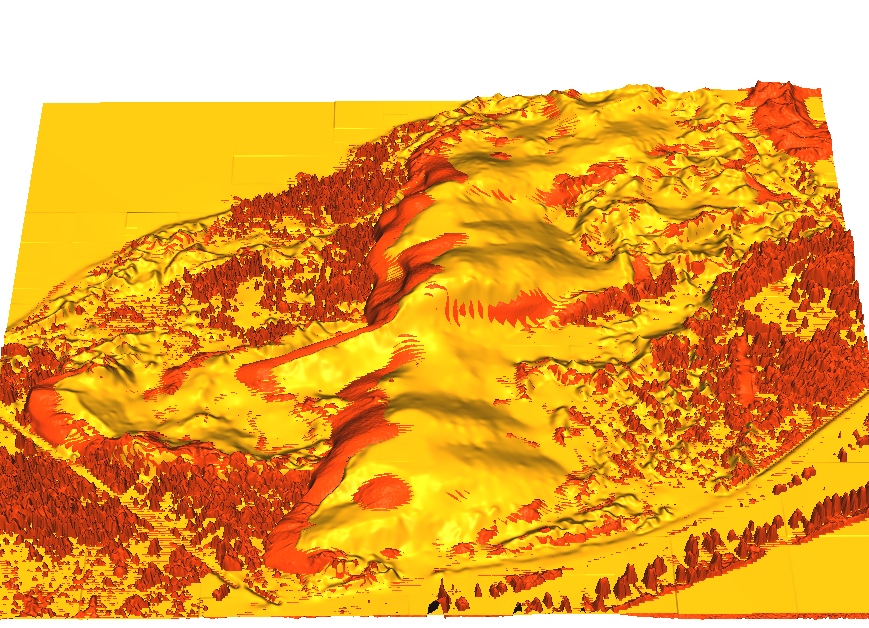
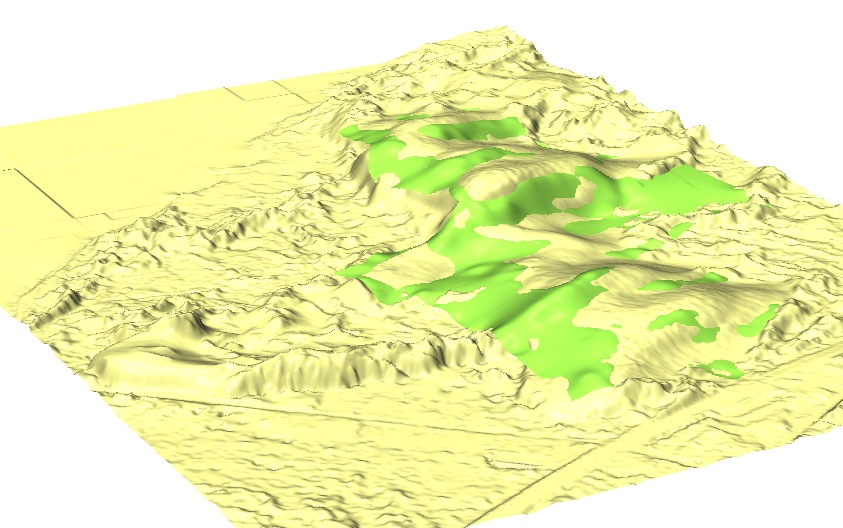
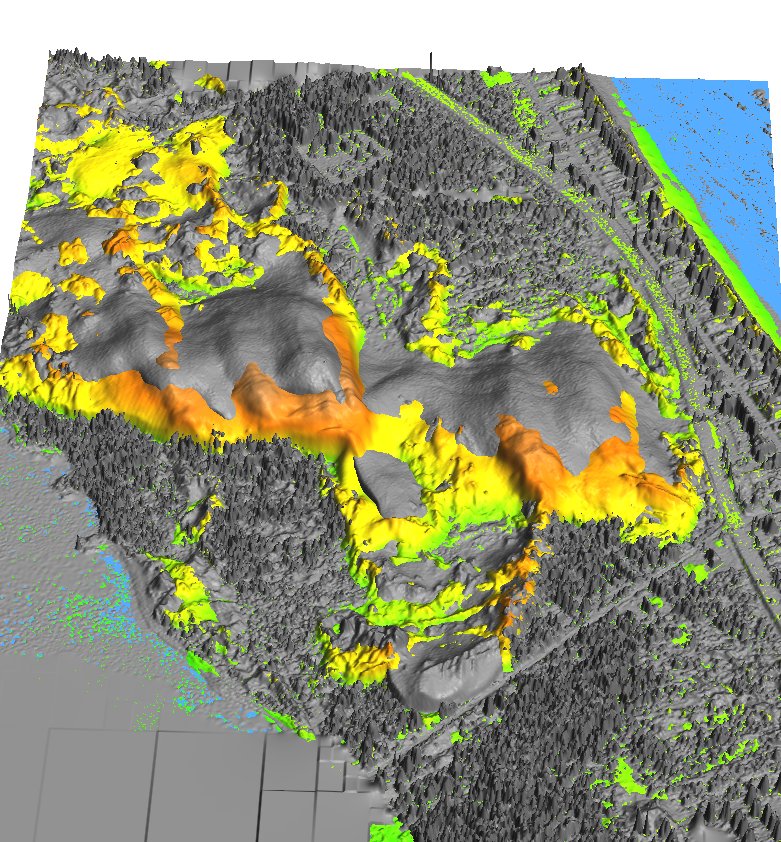
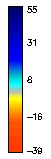
DEMs with change draped over the surface (blue is deposition, red-yellow is erosion, see the legend below)
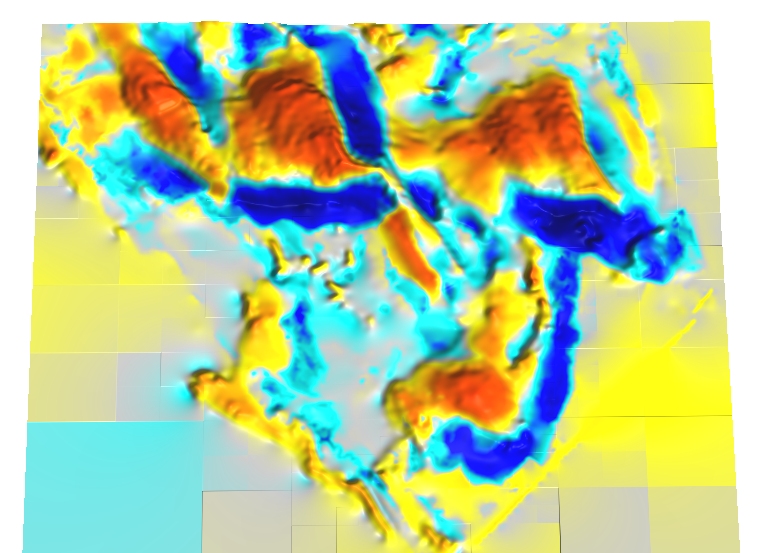 1974-95
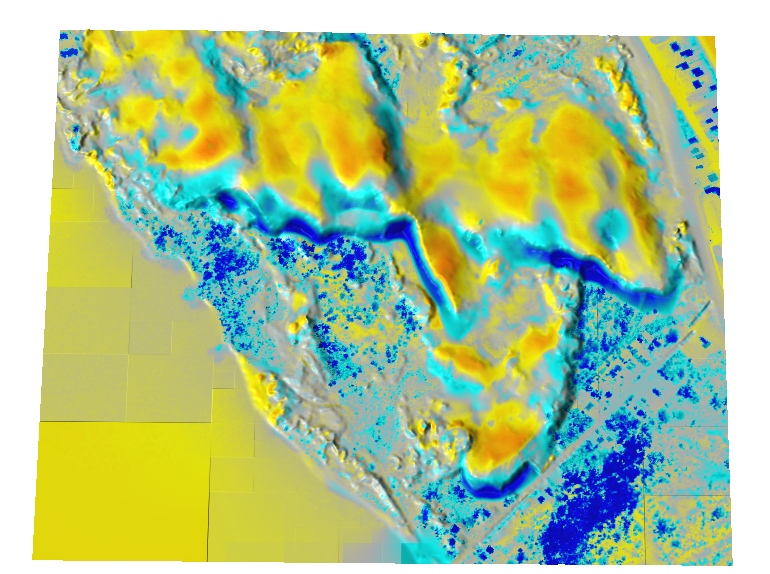 1995-99
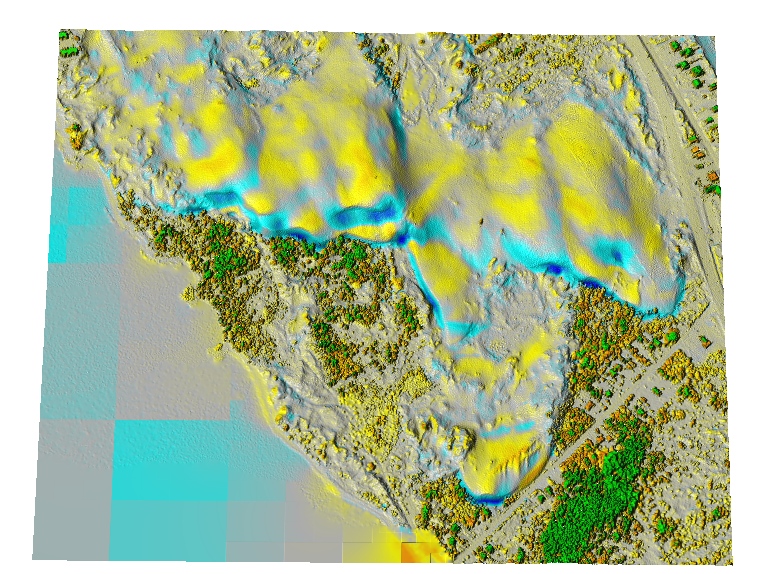 1999-01
 2001-2004
Migration of the dune represented by relocation of the 18ft contour
(see Overlay of the 18ft contour and slip face slopes):
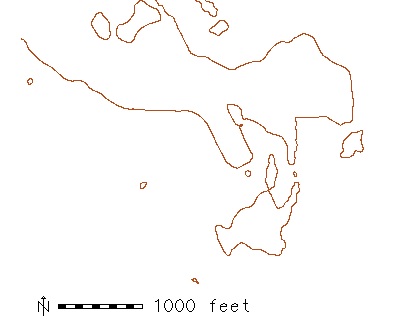
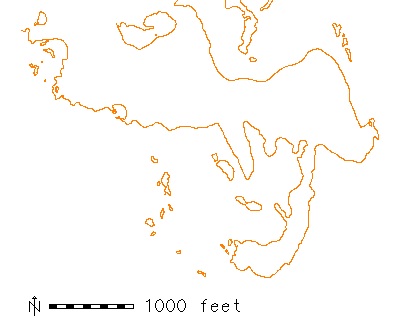
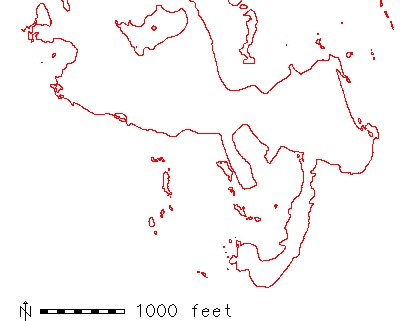
Contour z=18ft for the years:
1974||
1995||
2001||
Download as shape files here
Contours overlayed in a single image
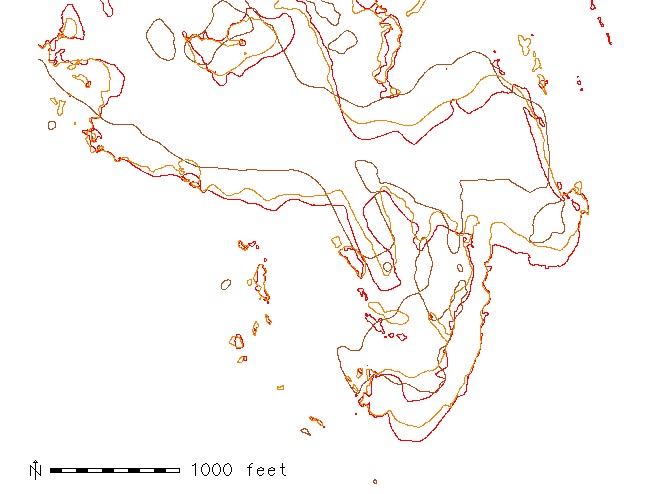 1974(brown),95(orange),01(red)
Change in the horizontal location of 18ft contour: red is erosion, blue is deposition
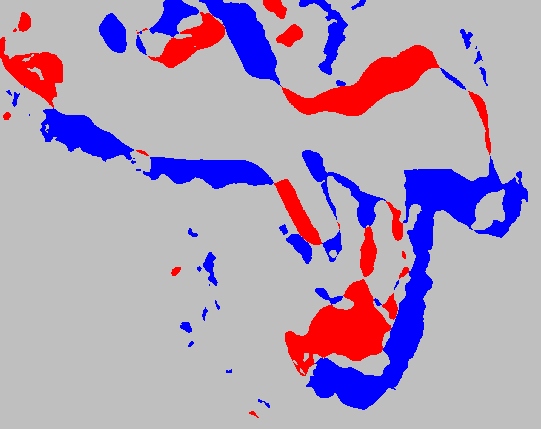 1974-95
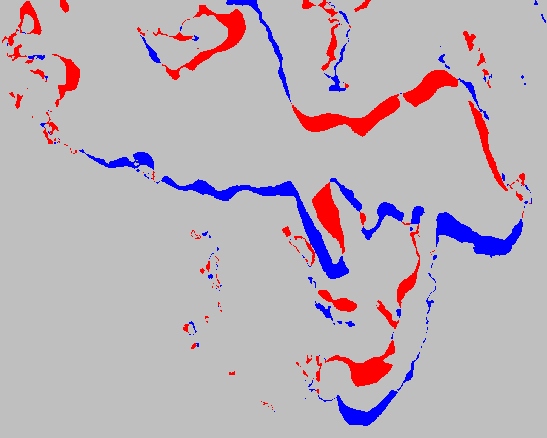 1974-95
Note: the 1999 LIDAR surface includes vegetation,
the 2001 LIDAR DEM has the vegetation and homes removed
- they show as a loss, mostly colored in green
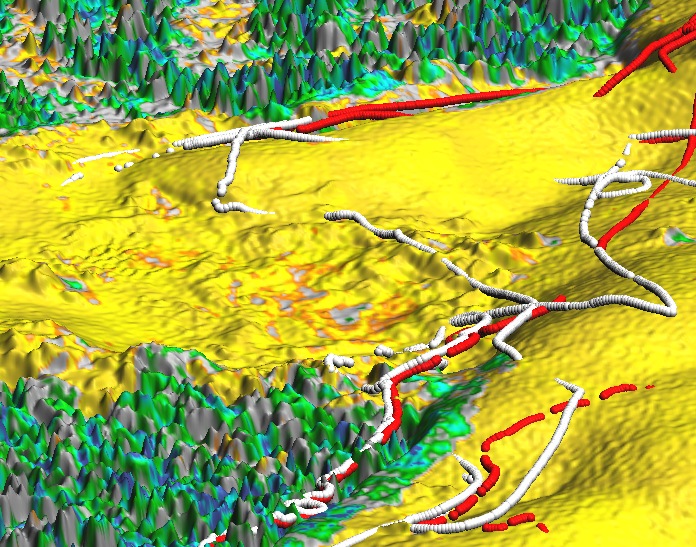
Moving features
 All ridges 1974-2001
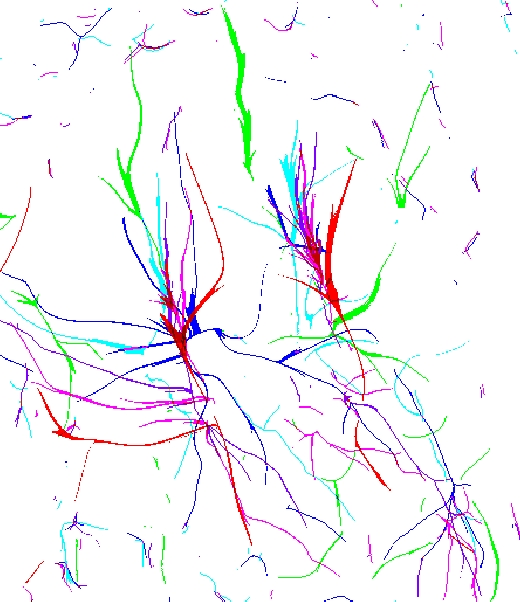 All ridges 1974-2001
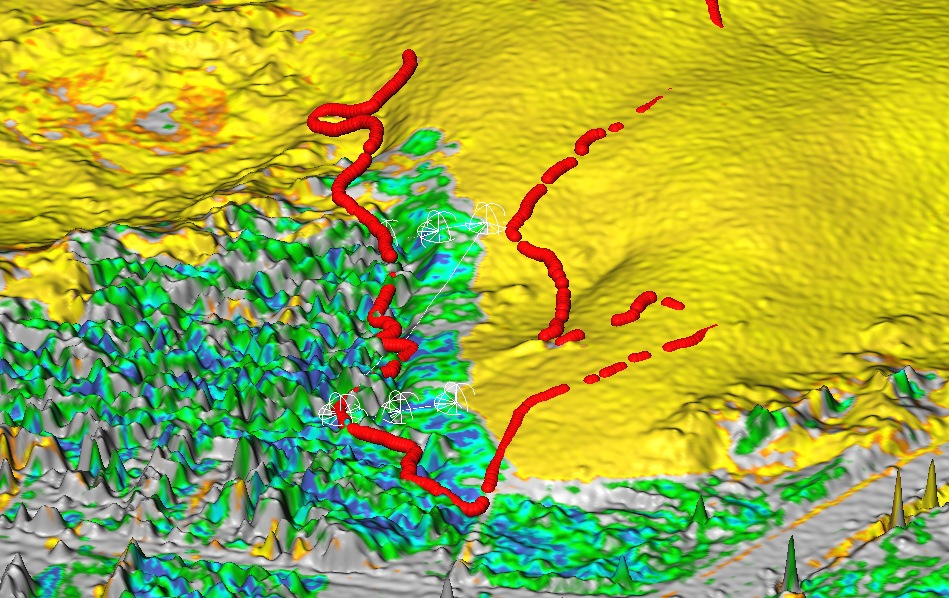
We used 2002 Real Time Kinematic Surveys of the dune's critical areas
to assess its change between 1999-2002 (done before we got the 2001 LIDAR):
-
Table showing the horizontal and vertical dune movement
between 1999 and 2002
-
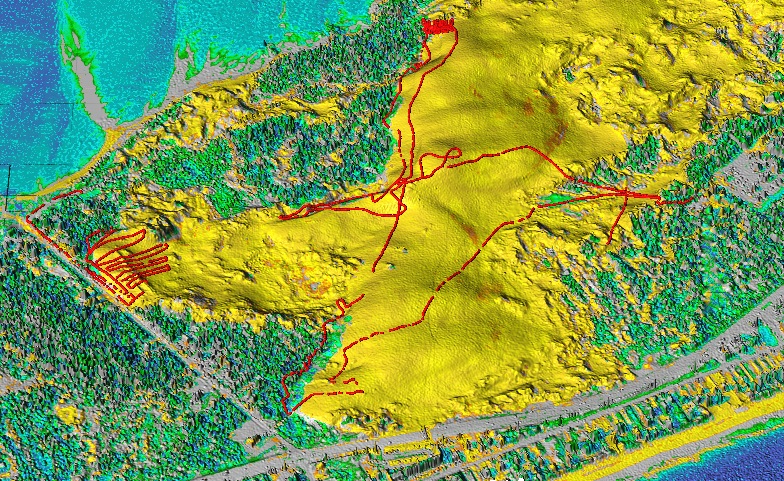
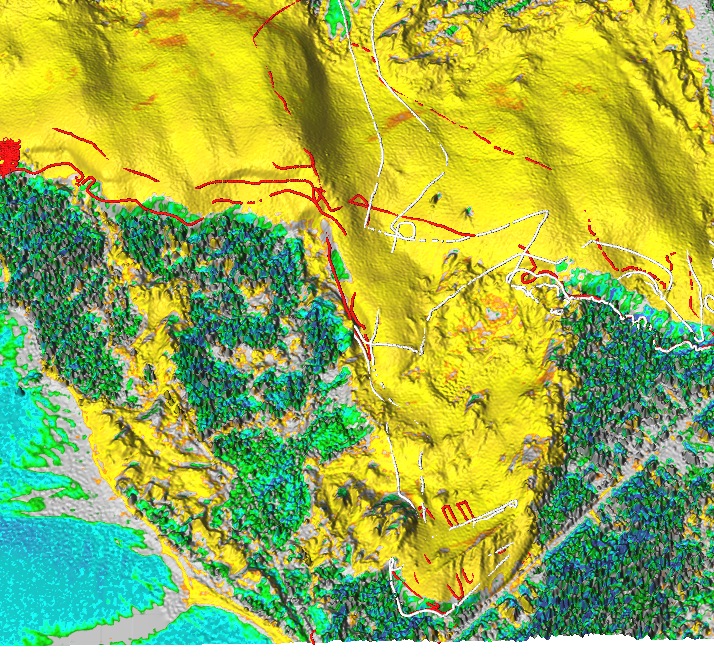
LIDAR-based 1m resolution DEM, with IR-DOQQ draped
over it and red dots representing the path of
Real time kinematic survey January 2002 -
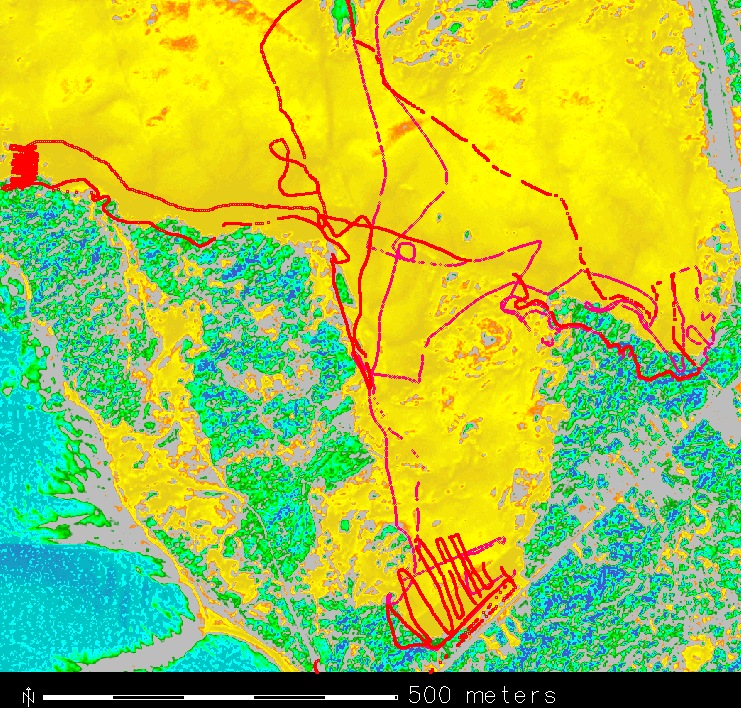
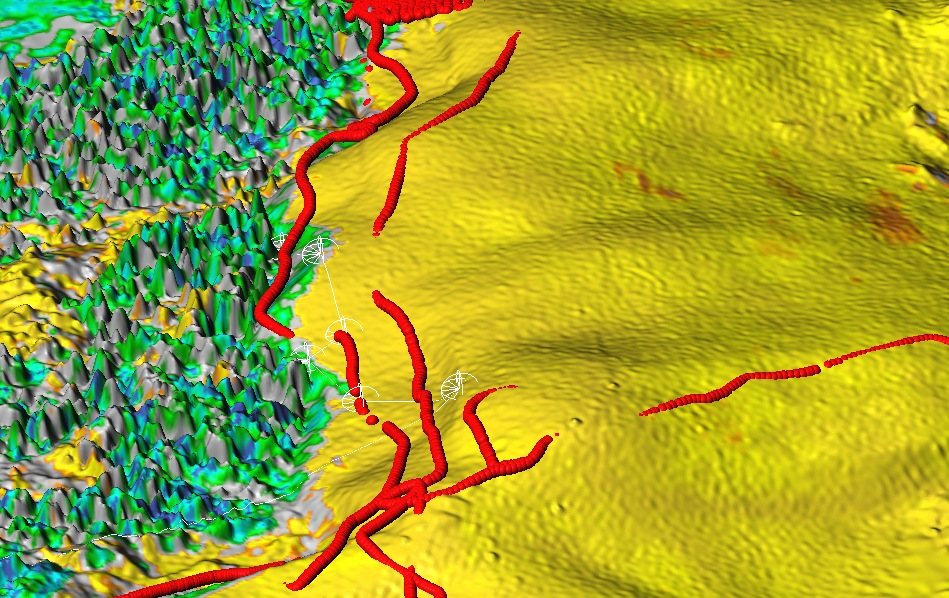
LIDAR-based 1m resolution DEM, with IR-DOQQ draped
over it. Red and white dots represent the path of
Real time kinematic survey January 2002 and April 2002 -
IR-DOQQ based 1998 land cover with January 2002
(bright red) and April 2002 survey (pink) showing
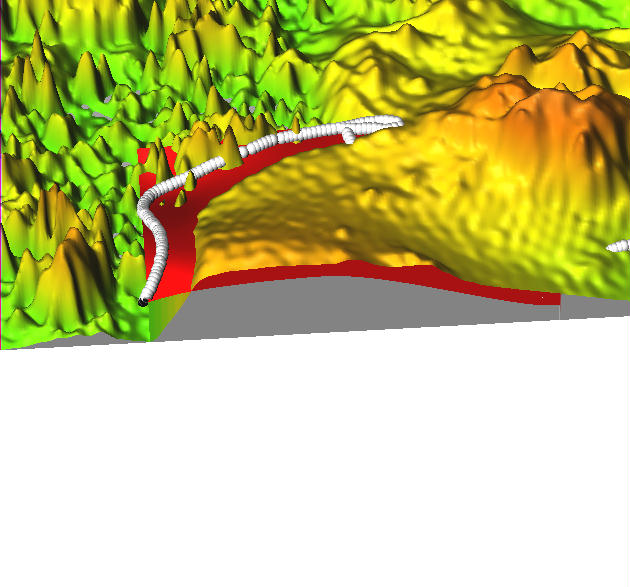
the movement of dune into vegetated areas.- Detail 1: South dune moving towards the road and homes
- Detail 1: Vertical profile (view from south)
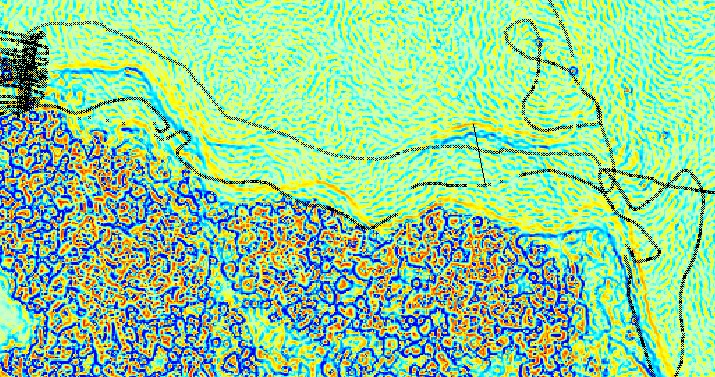
- Detail 1: Profile curvature overlayed with RTK-GPS
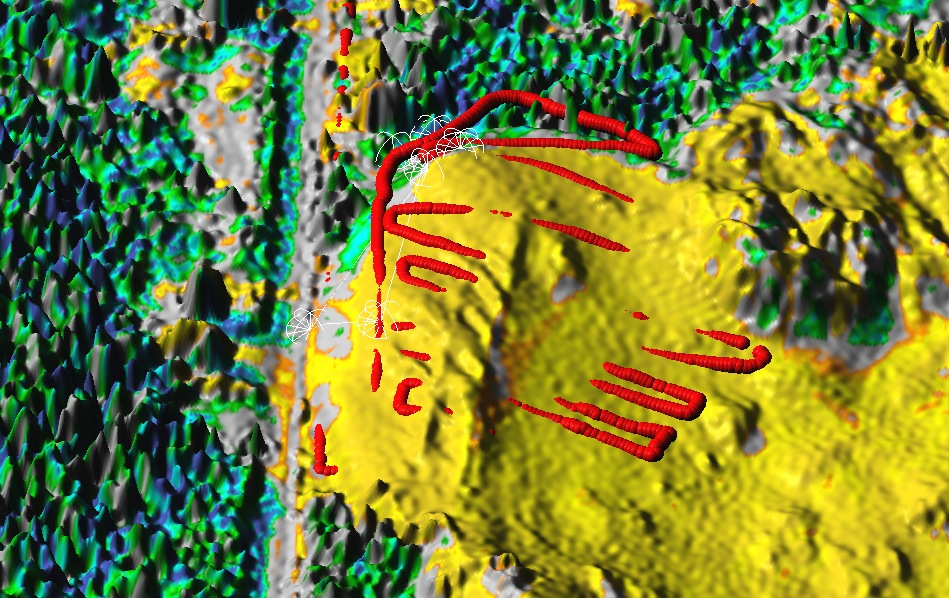
- Detail 2: East dune moving towards the road at 20m per year
- Detail 3: Main ridge, the crest moving 20-40m per year to south, the top lost 2m over past 3 years
- Detail 3: Profile curvature overlayed with RTK-GPS
- Detail 4: Lower central area is growing, white points represent April 2002 survey