
 developed
with GRASS5.0
developed
with GRASS5.0
COURT CREEK PILOT WATERSHED -
TOPOGRAPHIC ANALYSIS AND EROSION MODELING
WORKPLACE DOCUMENT
October, 2000
Helena Mitasova, Bill Brown, Doug Johnston, Lubos Mitas
University of Illinois at Urbana-Champaign
Notes, questions
and comments
Article for Watershed
Management Briefs
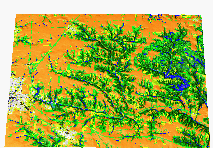
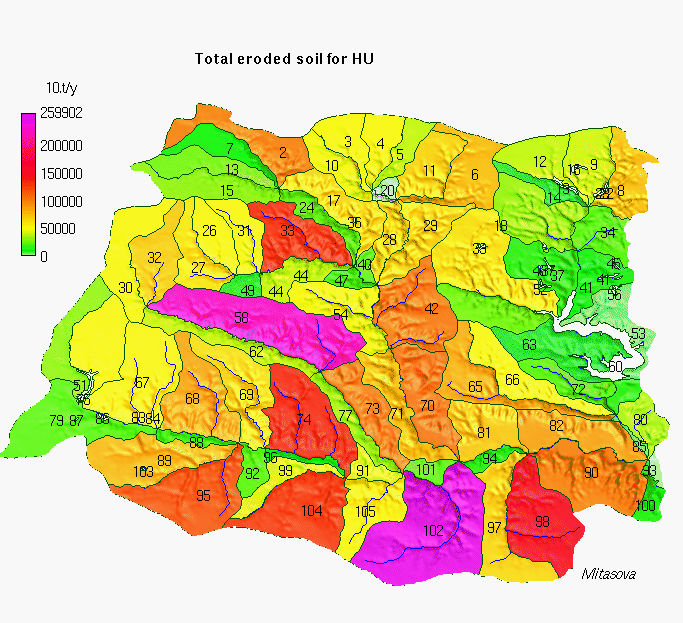
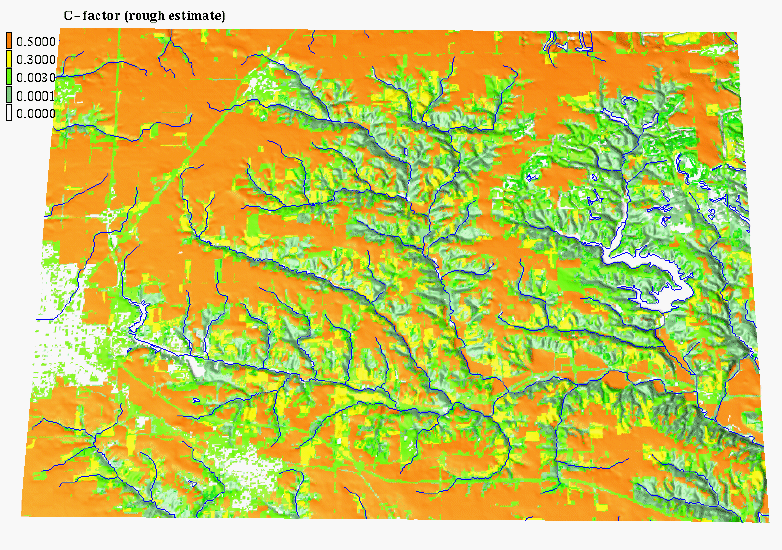
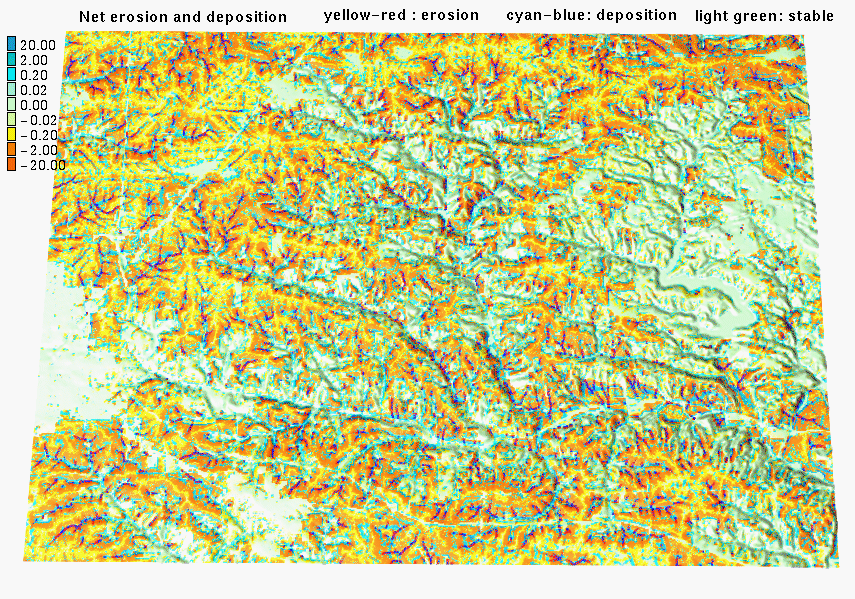
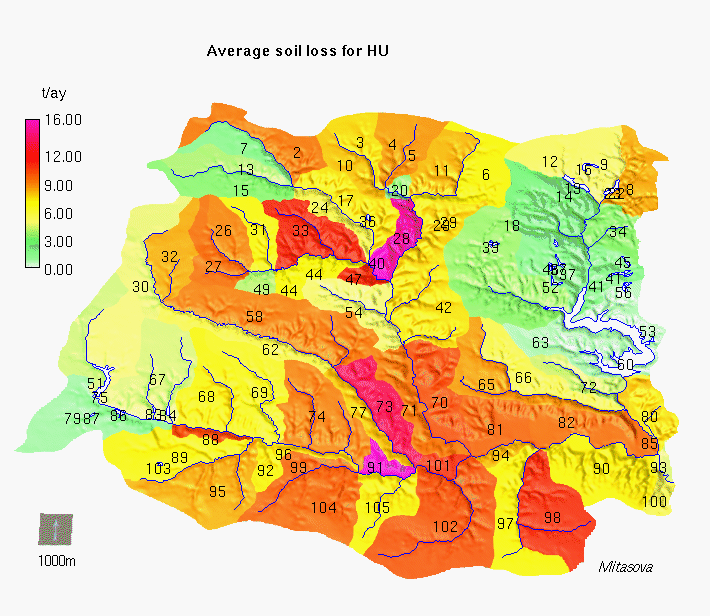
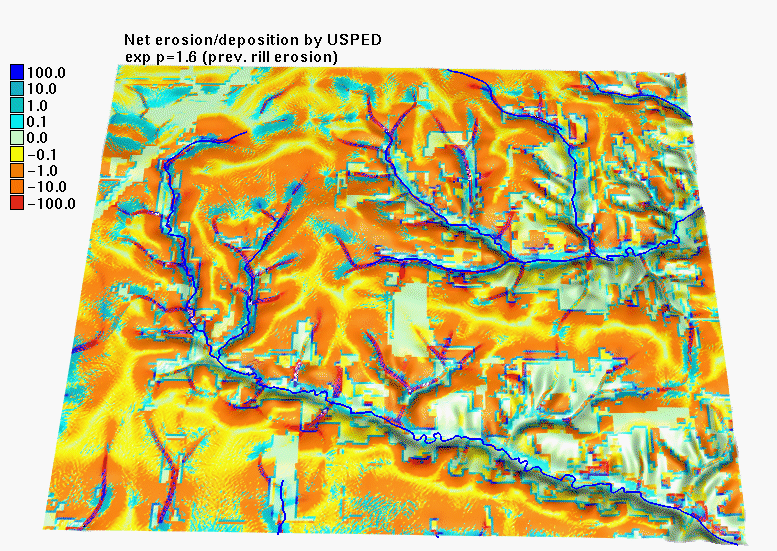
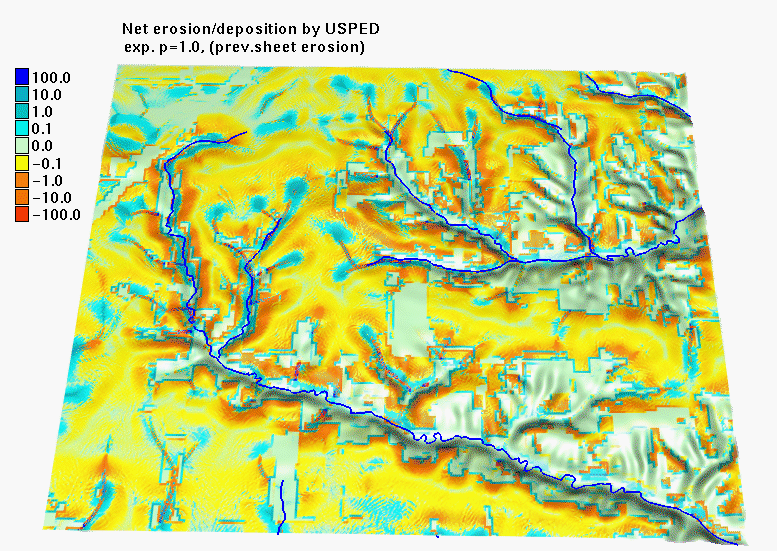
Analysis of soil detachment and erosion/deposition patterns
was performed using the new 10m DEM (see discussion about its problems
below). The patterns were simulated for the hydrologic
unit 52 for the following scenarios: bare soil, corn,
corn+60ft stream buffer, corn+100ft stream buffer, corn+60ft stream
buffer+forest on slopes steeper than 10%, current (1993) land use, corn + protective
areas (dense grass, forest) in locations with detachment rate higher than 10t/ay.
The results (maps and numbers) are organized in a
TABLE
and include some comments and suggestions.
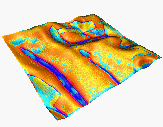
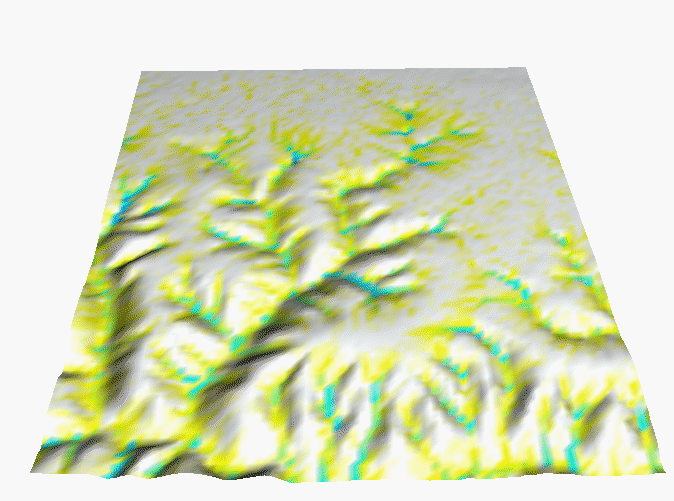
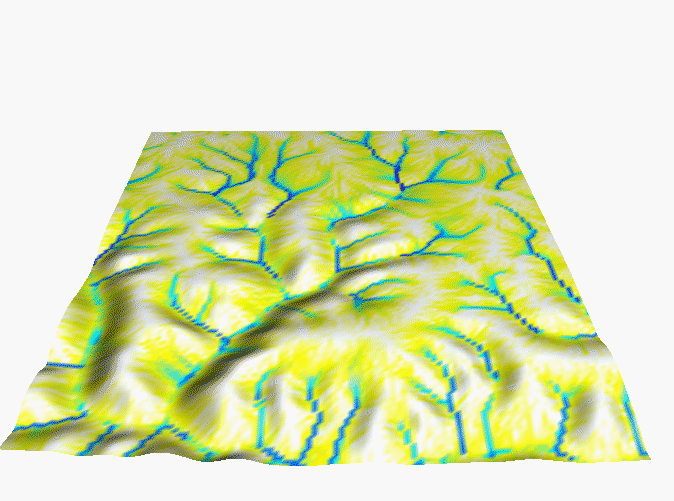
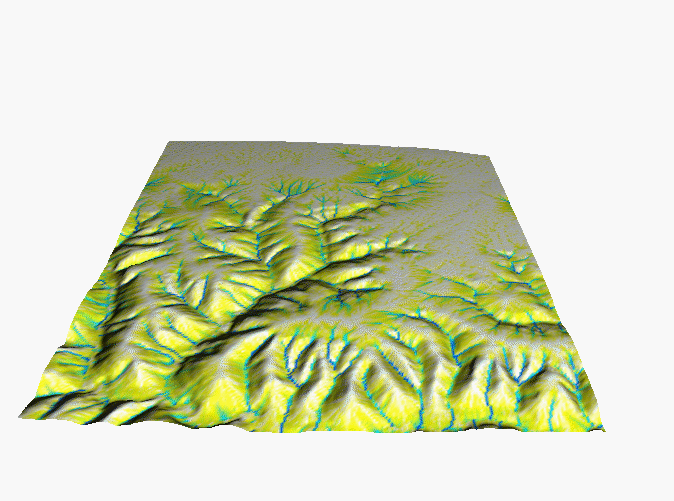
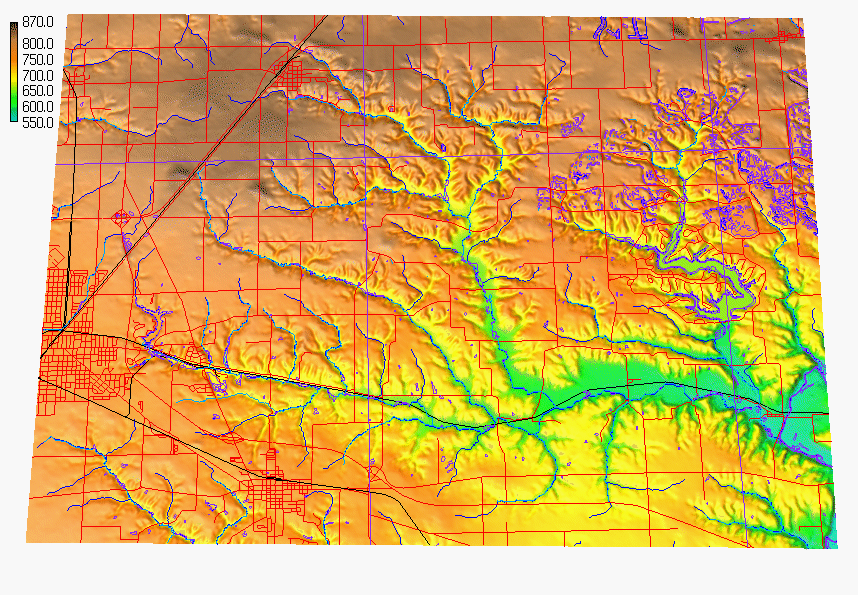
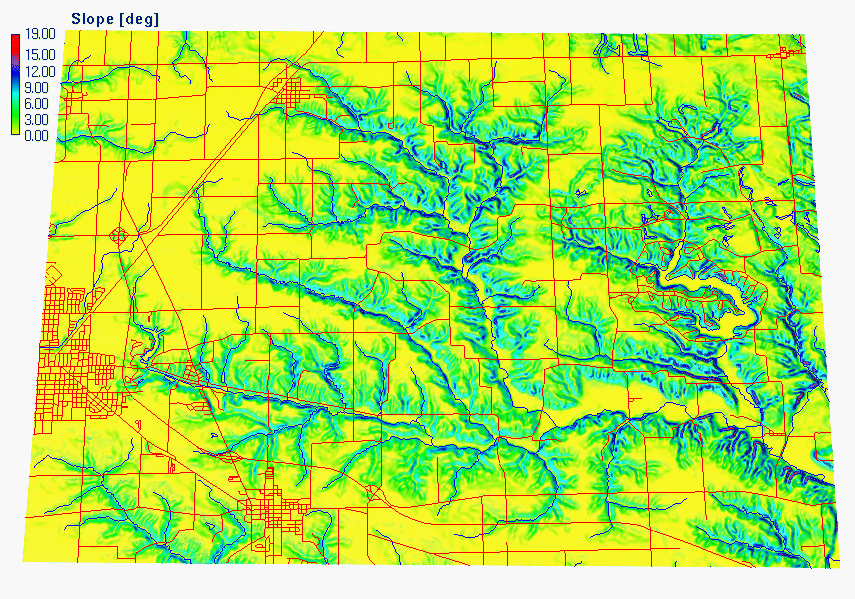
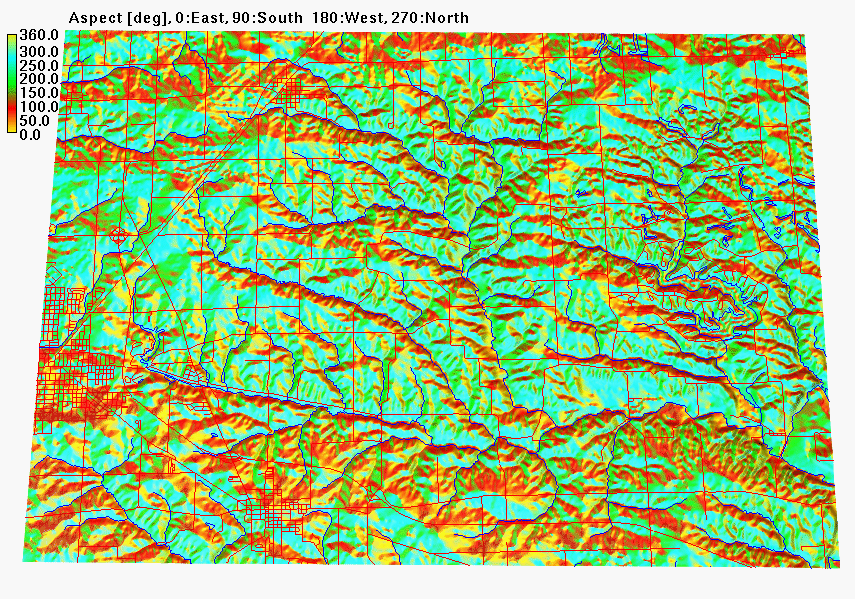
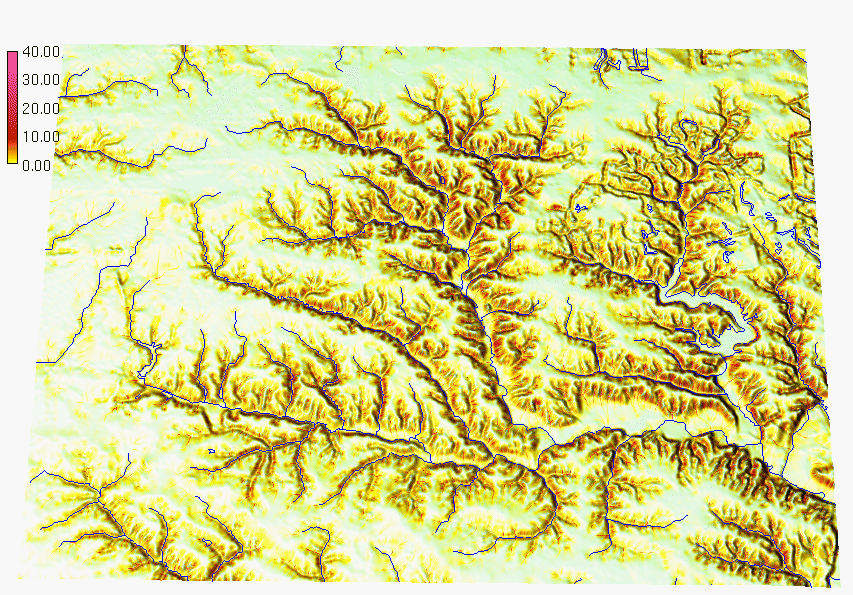
Analysis of new 10m DEM
New 10m DEM has been received and it is being analyzed.
There seem to be waves along contours which
may cause problems for erosion/deposition modeling, if these waves
are artificial:
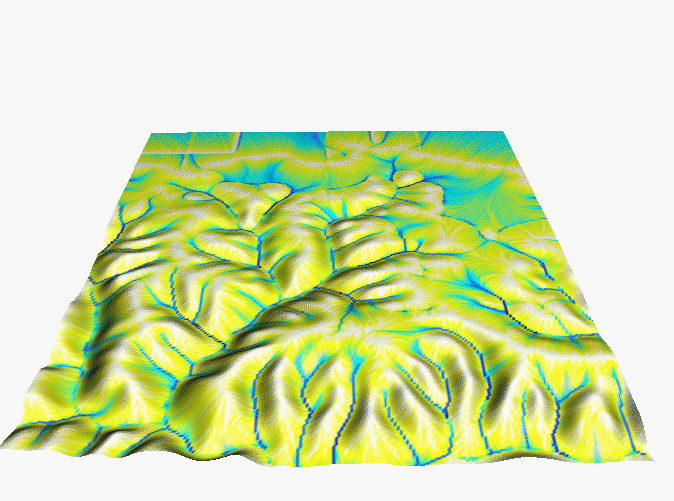
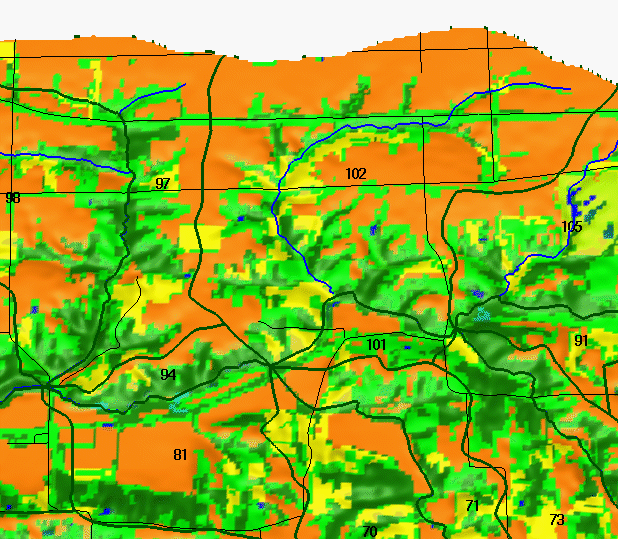
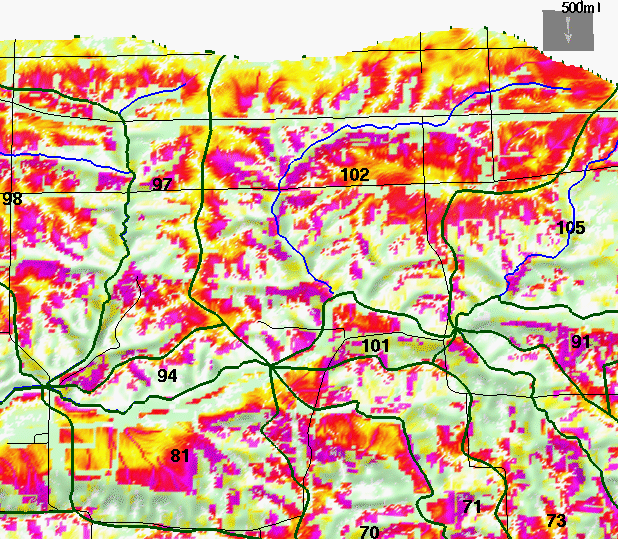
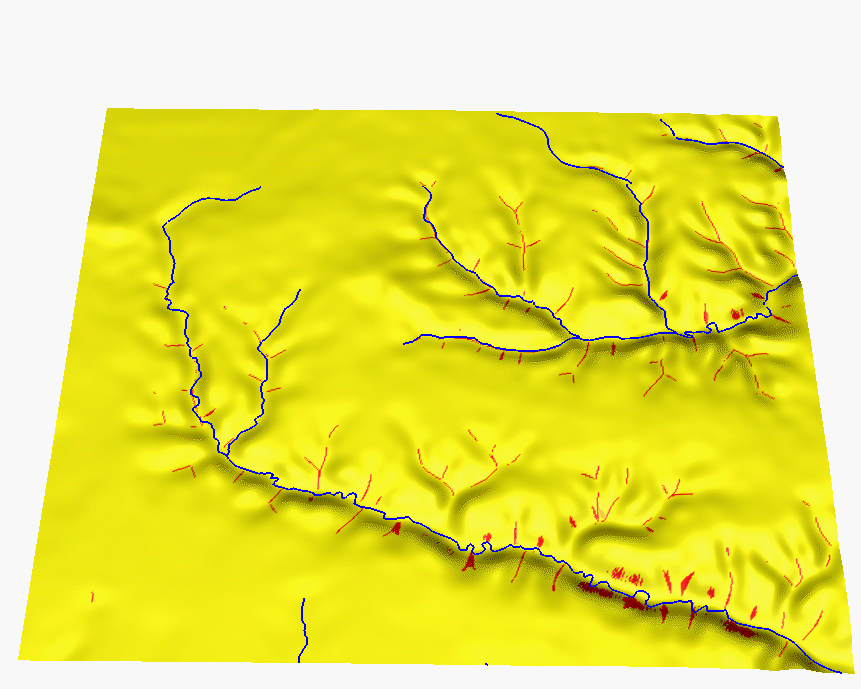
3D view of terrain within the hydrologic unit 102
location of the hydrologic unit 102 can be found
on this picture
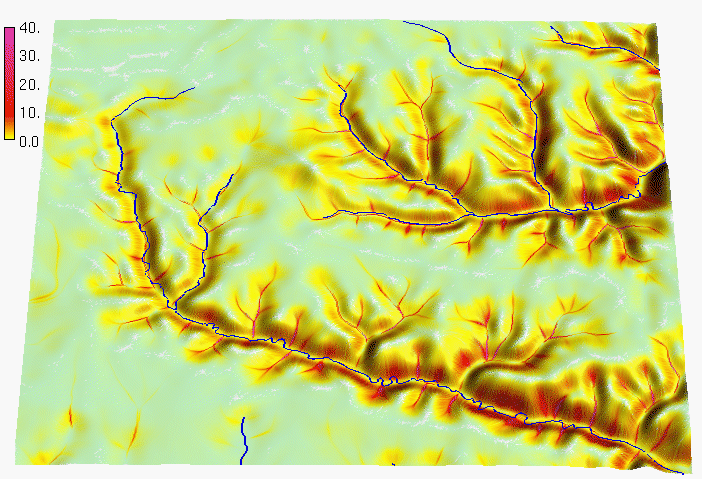
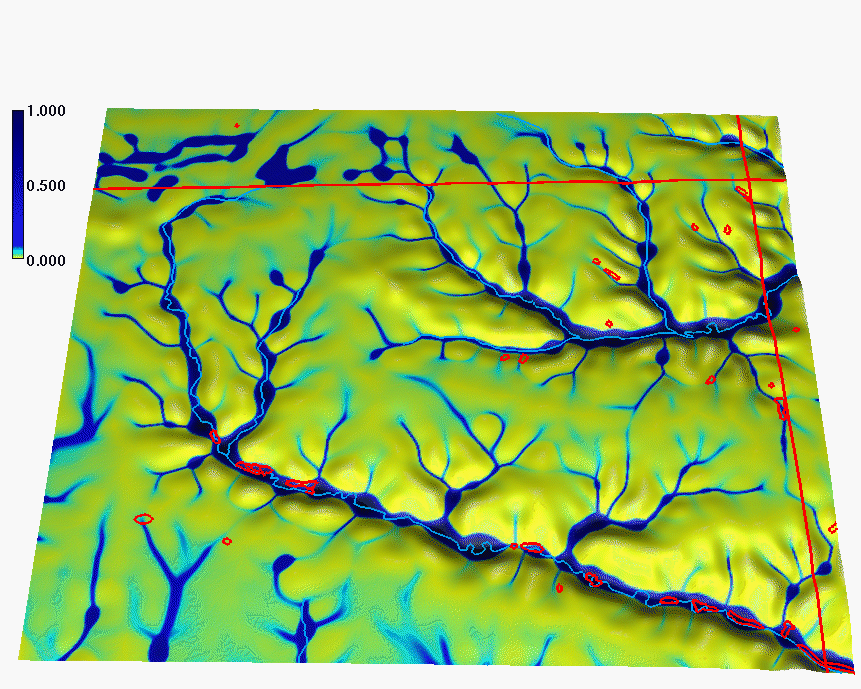
The new DEM has substantially more detail than the 30 m DEM which we have used
before. While the total amount of water flowing out of the watershed would be
the same, the new DEM shows that the flow from hillslopes and first order
watersheds is much more in the form of concentrated flow rather than sheet flow
predicted from 30m DEM. The following figures show the flow patterns derived
from the DEMs that we have been using (note these are draft pictures and will be
replaced by more consistent ones inthe final document)
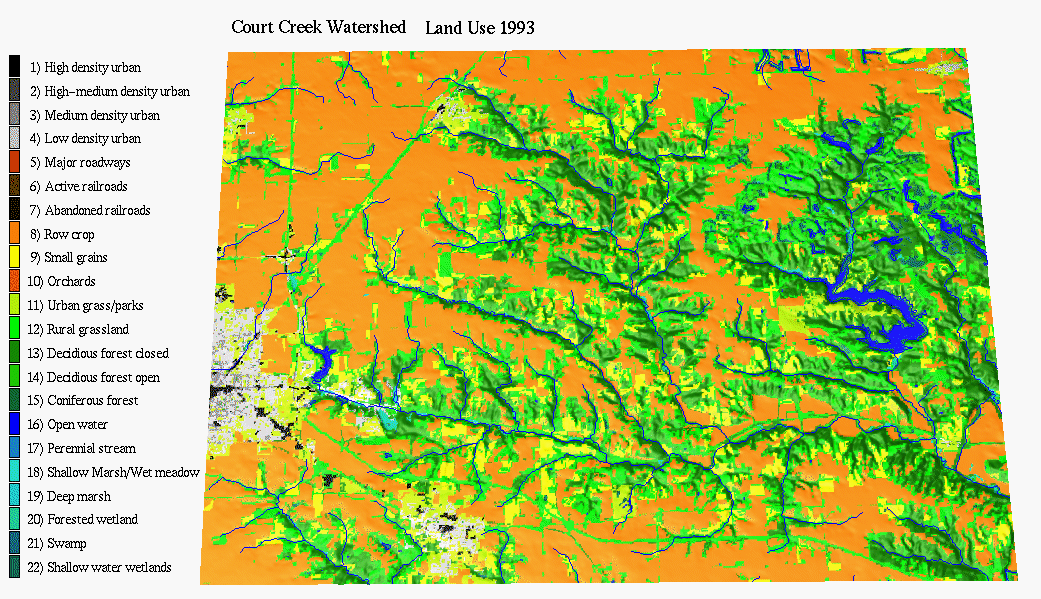
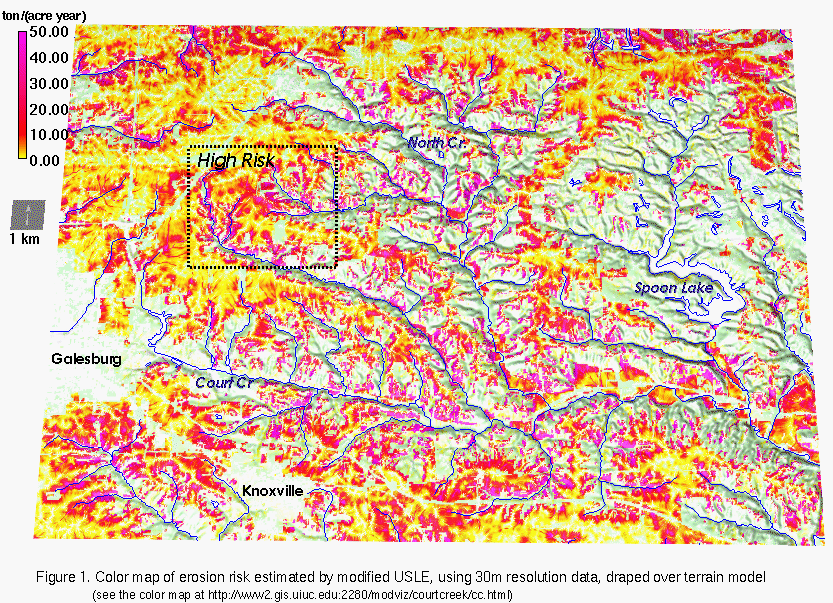
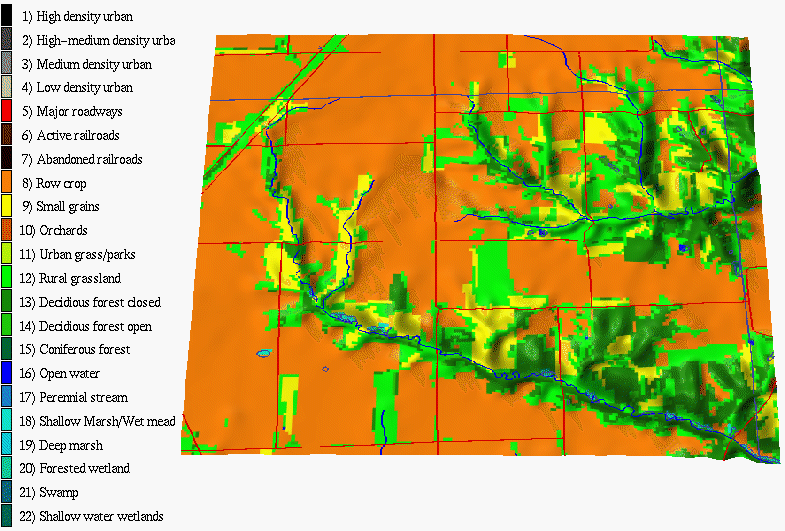
Low resolution (20m/10m) analysis aimed at land use management at a regional/watershed
scale
Statistics/summaries from the data and preliminary
erosion estimates at 20m resolution. (averages, totals, [%] areas ...)
Results for a link with the ISWS model
Note: there is a mismatch between the numbers for HU in our and ISWS
data which has to be fixed
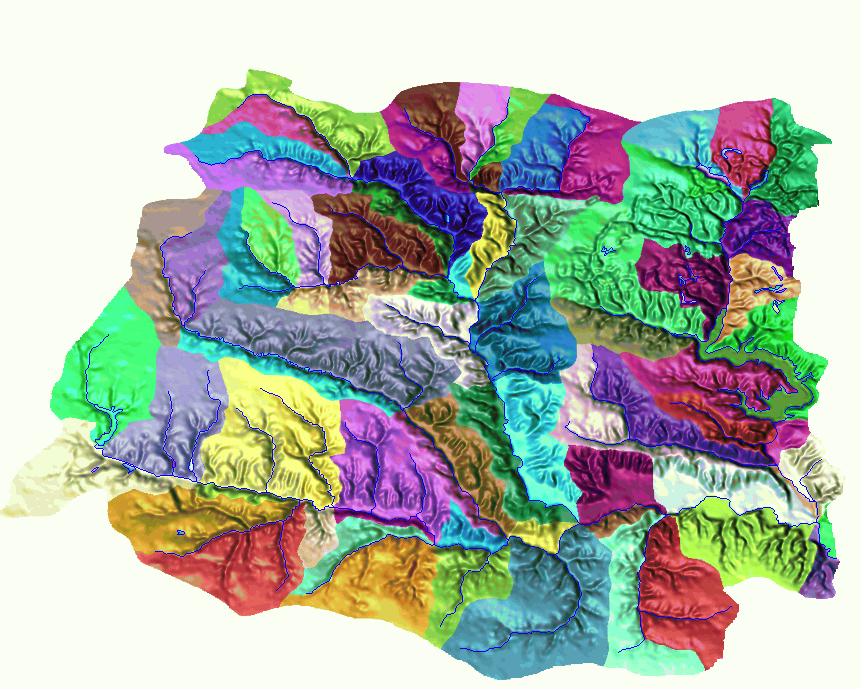
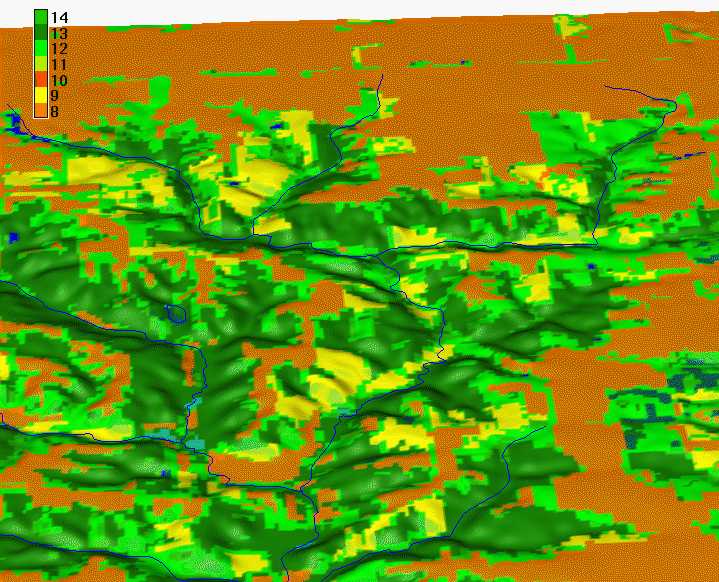
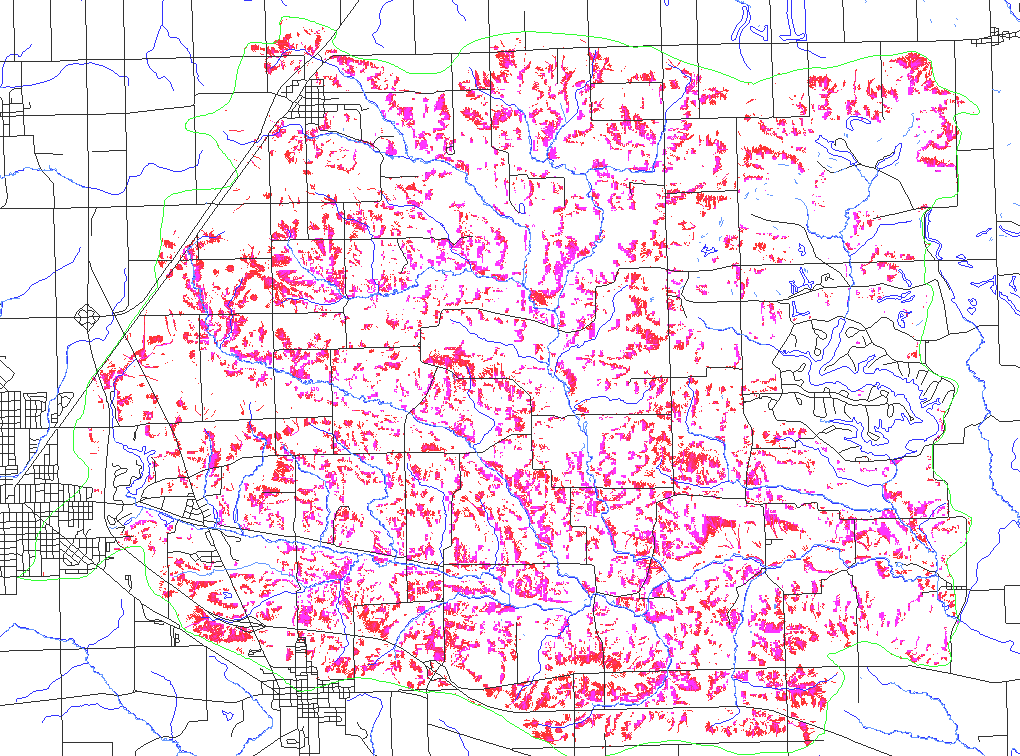
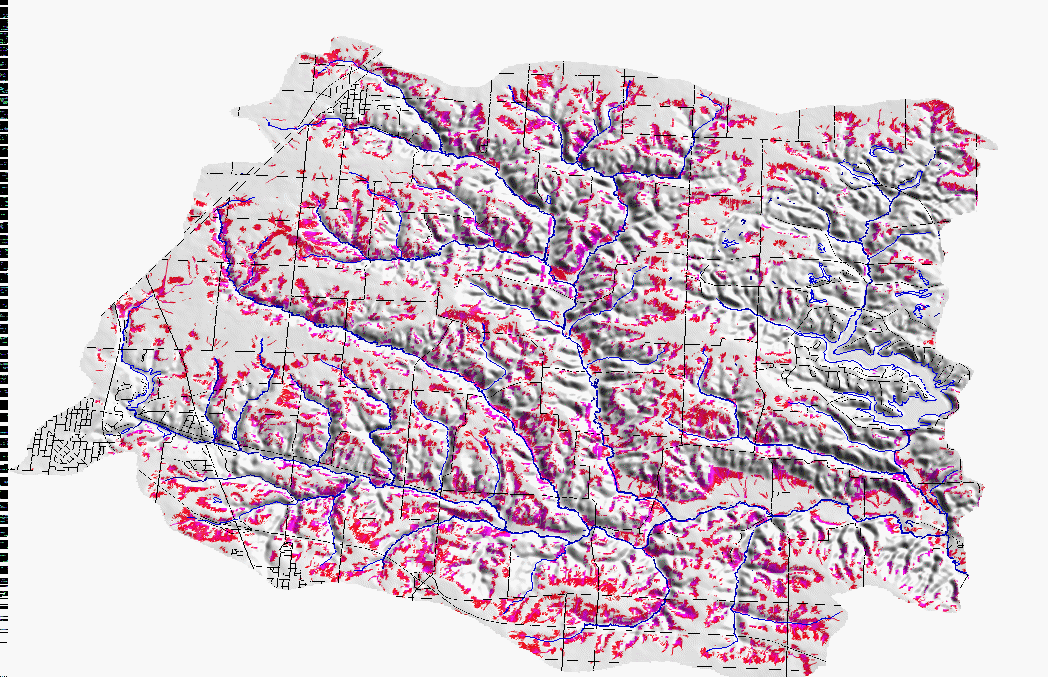
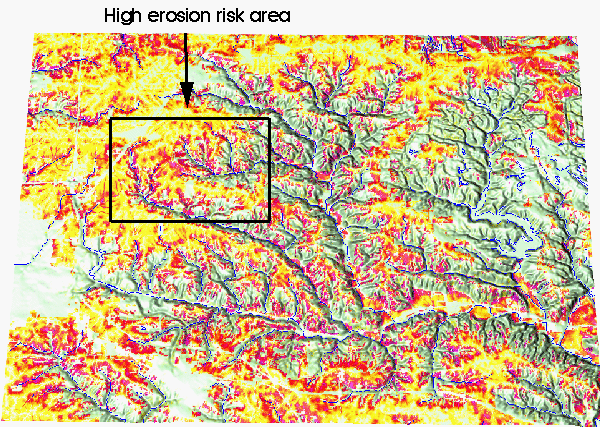
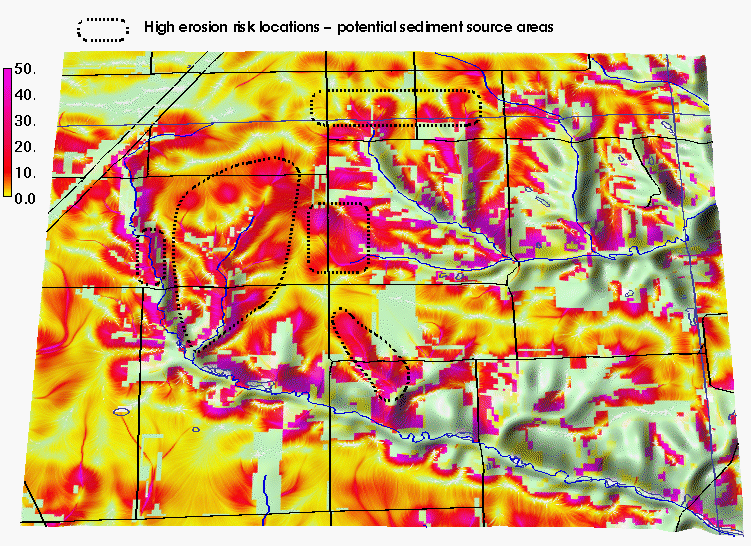
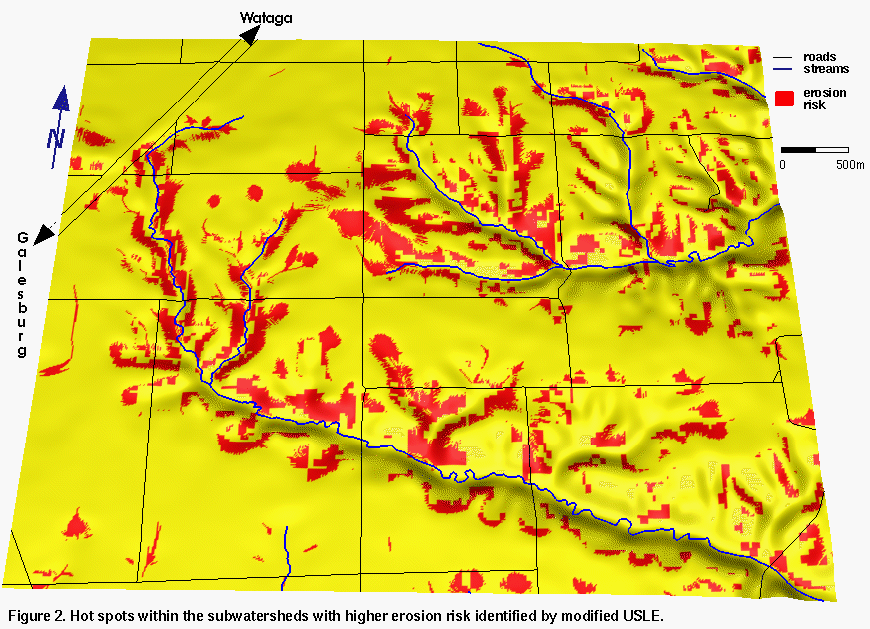
Subwatersheds with high erosion risk in headwater areas
The analysis has been performed using the same data as the analysis for
the entire watershed. The original DEM was reinterpolated and smoothed
from 30m resolution to 10m resolution to get better representation of terrain
geometry, however, no new information was added ( 1:24000 topographic map draped over the
smoothed DEM reveals that substantial detail is missing).
The results of erosion/deposition
model indicate that there is some limited potential for deposition within
the less protected headwater areas. This indicates that while farmers may
be loosing some soil there, part of the eroded soil moves only for a short
distance. Further modeling and analysis will be performed to estimate how
much can be delivered to streams and whether more protection in this areas
could have any substantial impact on water and sediment flow downstream.
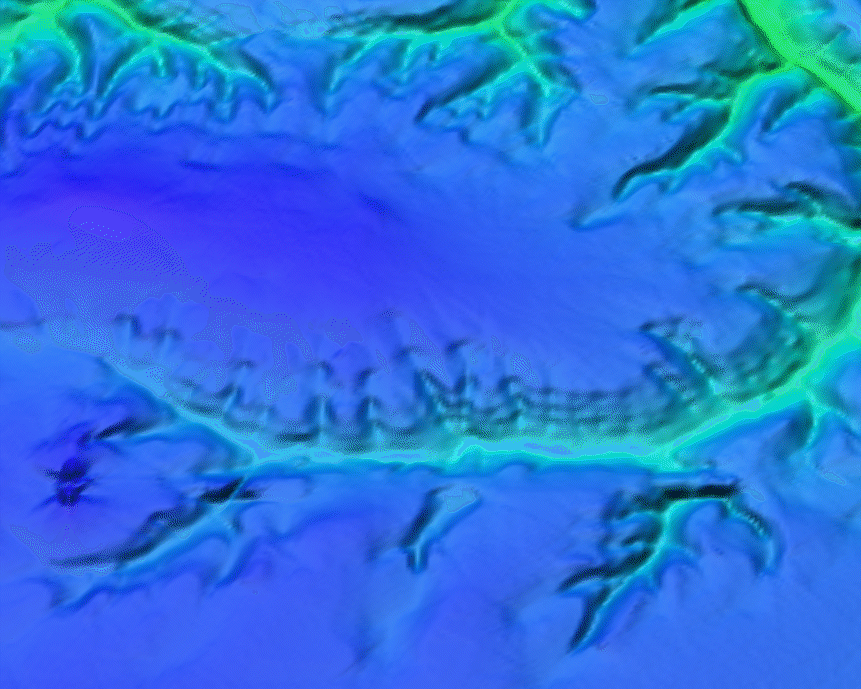
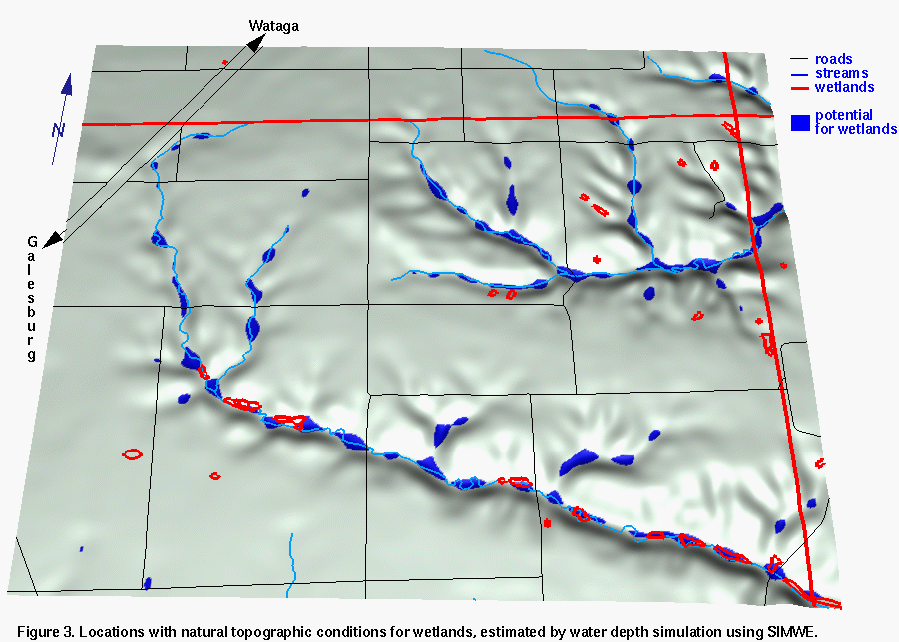
Analysis of topographic potential for wetlands
Hydrologic simulation module of SIMWE model was used to identify locations
which have terrain configuration suitable for accumulating standing water
and creating conditions for wetlands.
Statistics/summaries for the upper Middle Creek
from the data and preliminary erosion estimates at 10m resolution.
(averages, totals, [%] areas ...)
High resolution (<10) analysis aimed at modeling and design of conservation
measures at a local scale (in preparation)
before we get high resolution data for Court Creek, here are some examples
for different locations:
This project is supported by C-FAR IT-SRI and Illinois Department of Natural Resources
 GMSL Home Page
 GMSL
Modeling & Visualization Home Page
GMSL
Modeling & Visualization Home Page