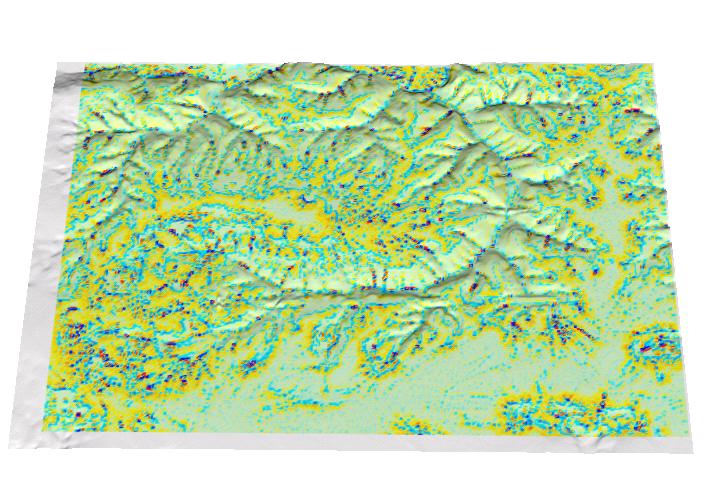
Court Creek Watershed
- Hydrologic Unit 52 [3.6 x 4.6km]
Analysis of soil erosion and deposition by water for different
conservation strategies
Helena Mitasova, University of Illinois at Urbana-Champaign,
Lubos Mitas, North Carolina State University, Raleigh
click on the
images to see the maps of land use, soil detachment and erosion/deposition
CAUTION! NUMBERS ARE RELATIVE! NO FIELD CALIBRATION OR VALIDATION WAS DONE!
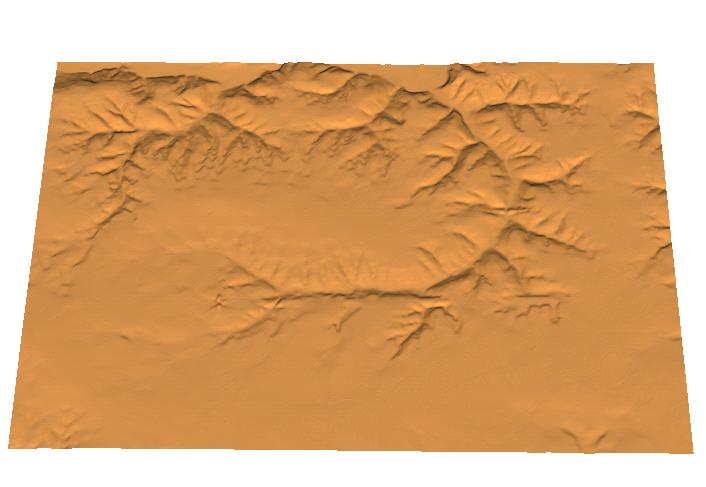
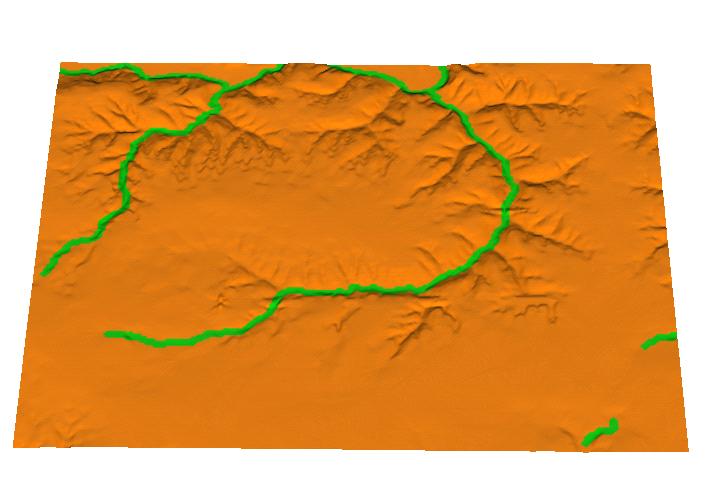
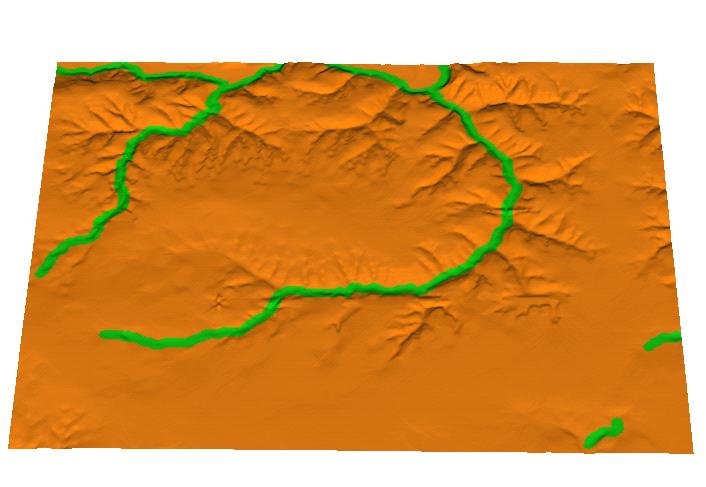
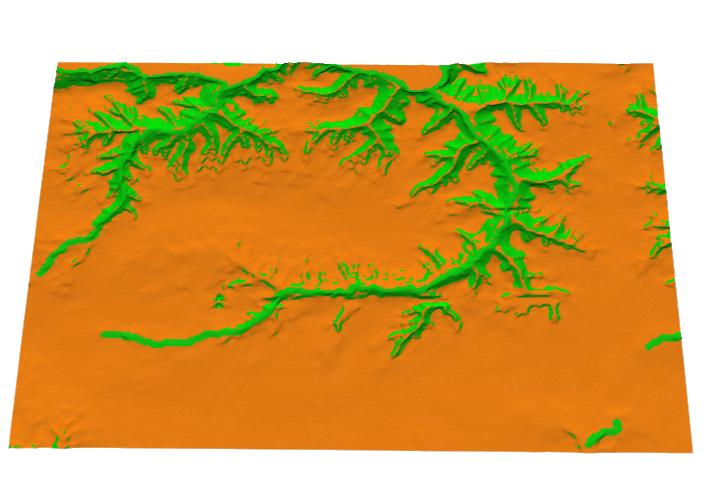
add basic topo map (elevation, roads, streams, urban, etc) here
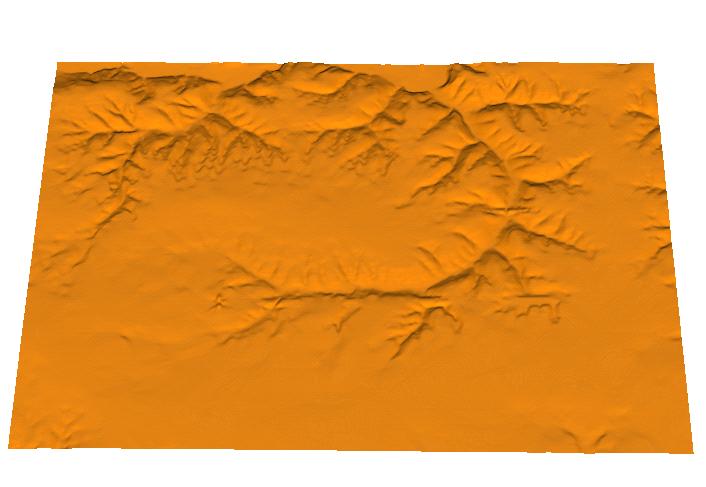
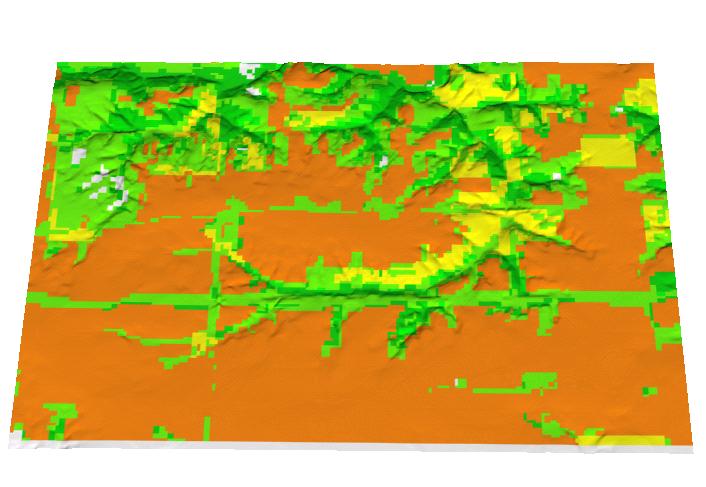
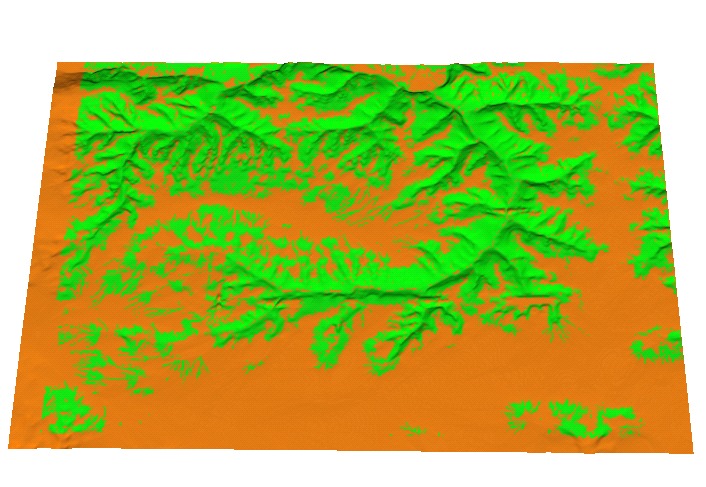
land use
legend |
%agriculture (row crops)
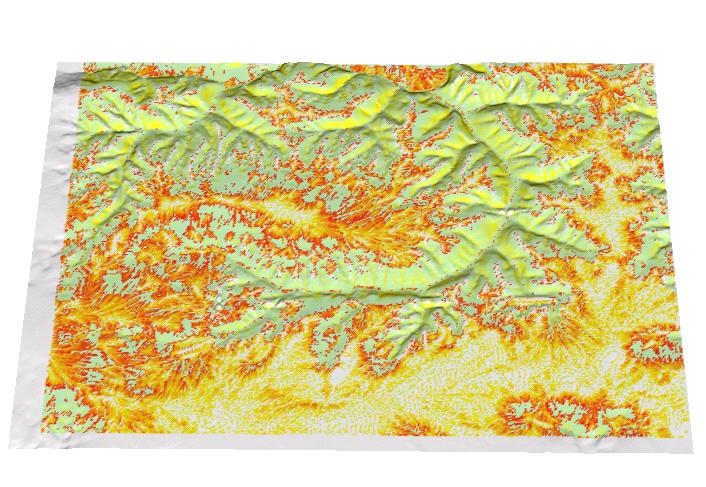
Cfac legend |
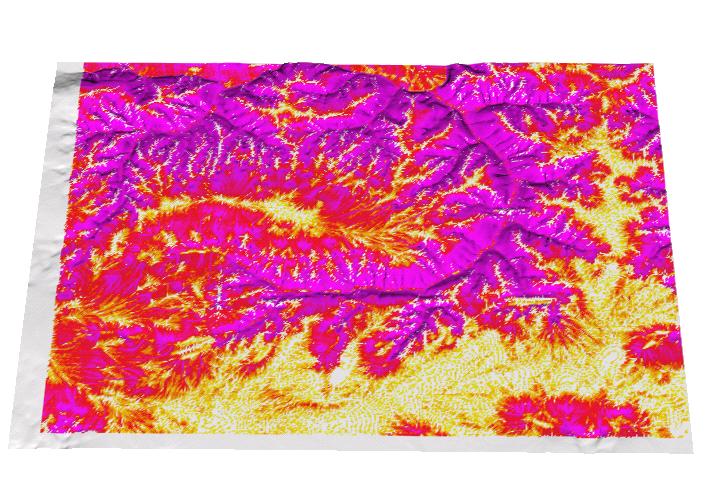
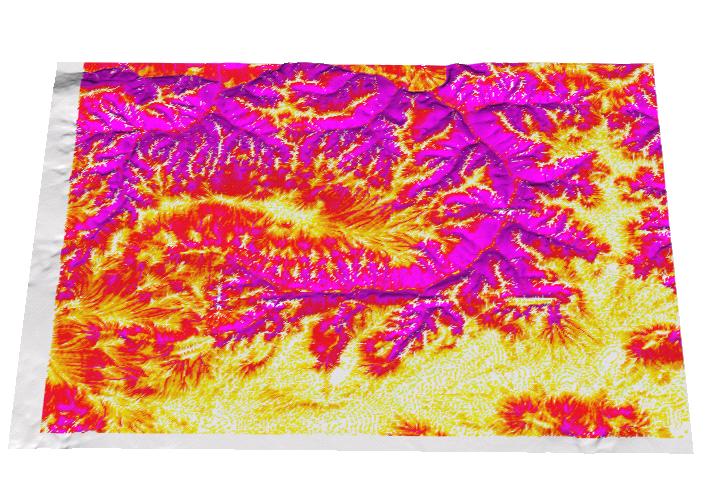
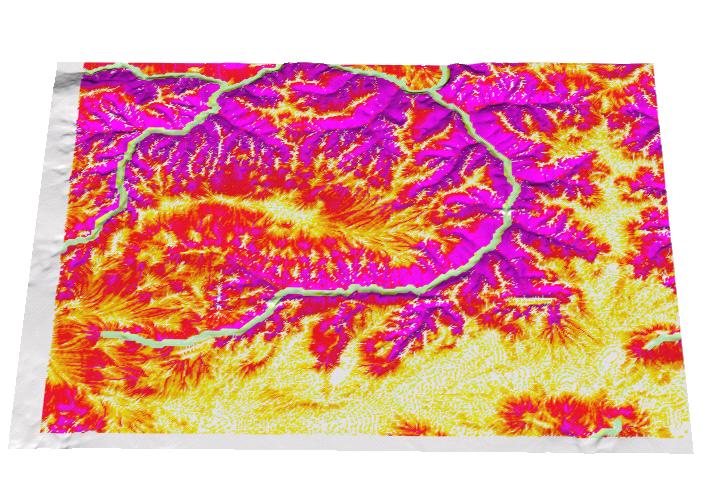
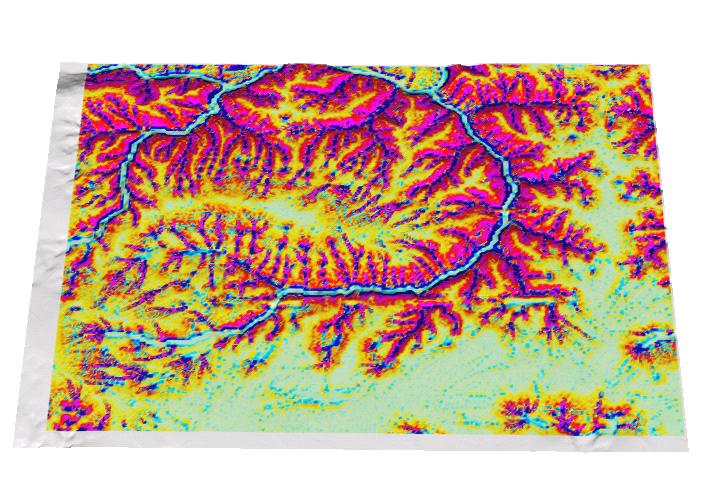
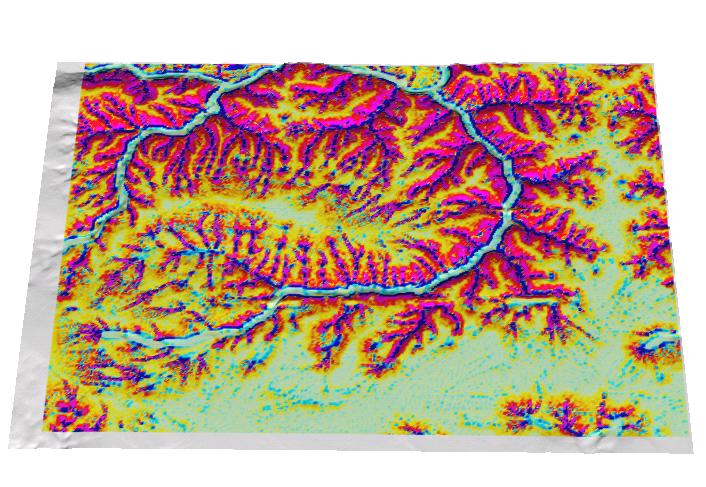
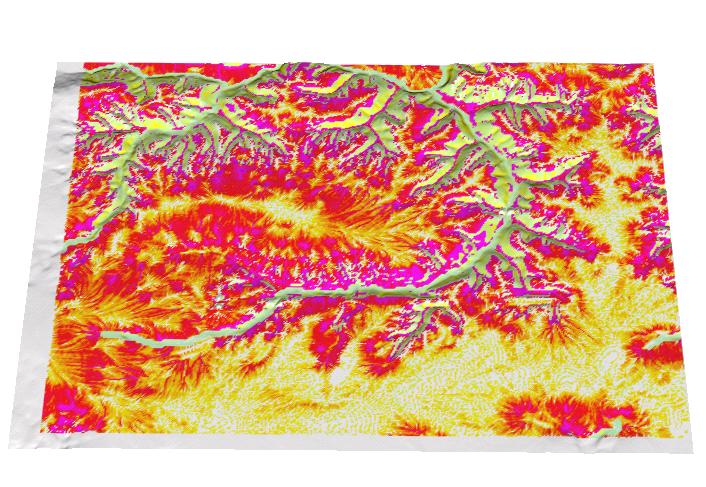
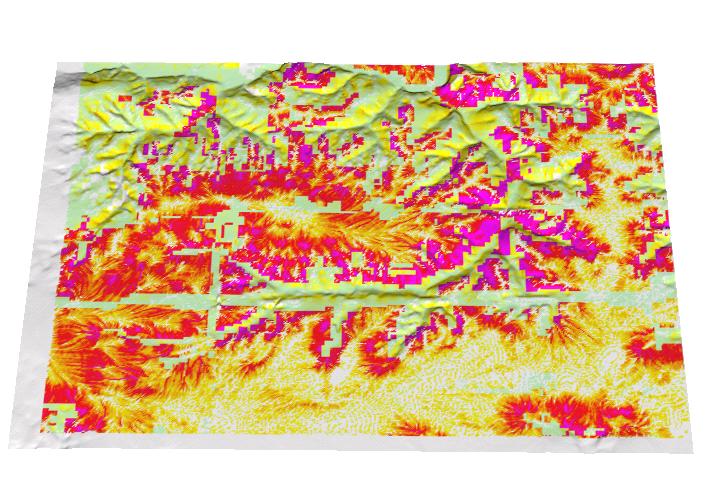
soil detachment:
total[1000t]/average[t/ay]
legend[t/ay] |
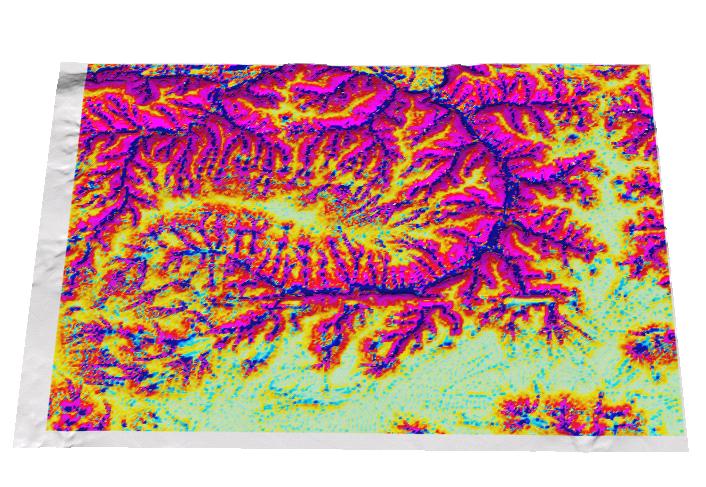
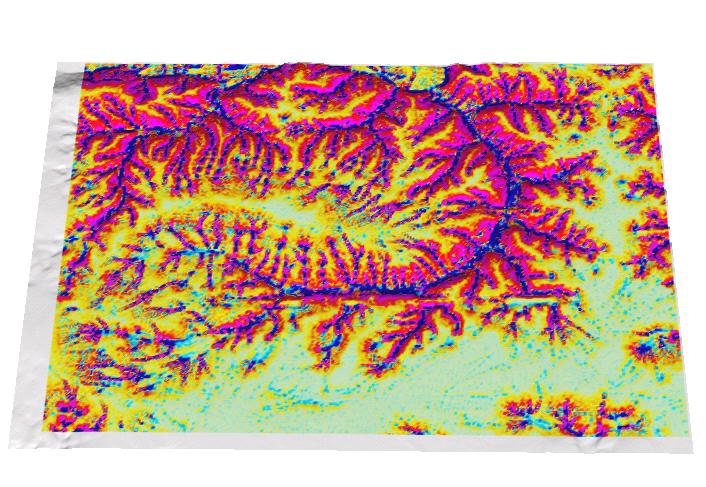
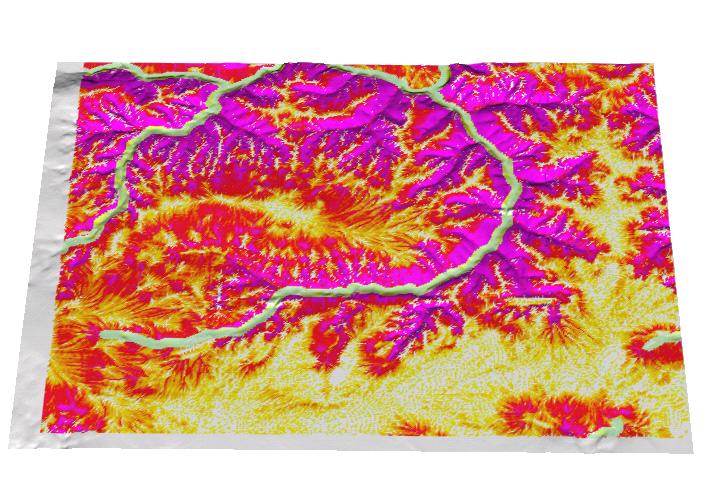
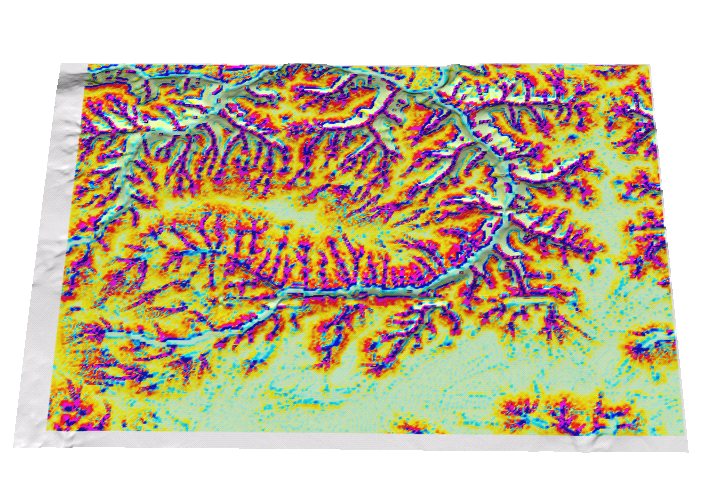
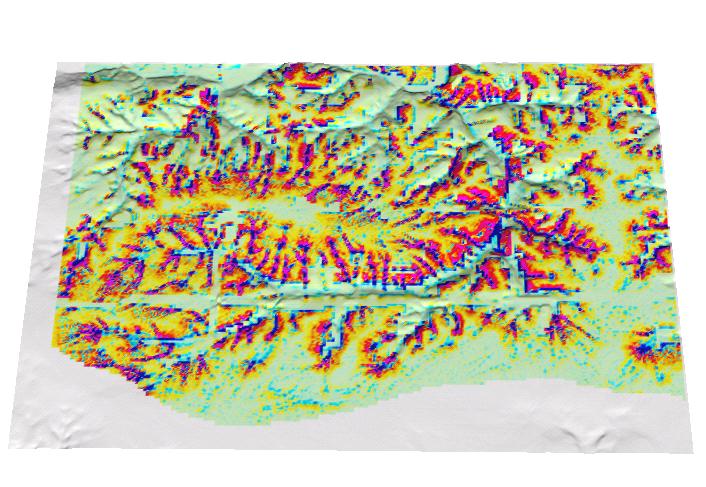
soil erosion/deposition: excess[1000t]
legend[t/ay] |
comments |
| bare
| N/A
 |
10,500 / 62
 |
77
 |
X |
| corn |
100
 |
5,200 / 31
 |
38
 |
X |
| 60 ft stream buffer |
96
 |
4,800 / 28

|
19
 |
only big streams have buffers |
| 100 ft stream buffer |
94
 |
4,600 / 27
 |
19
 |
only big streams have buffers |
| 60ft stream buffer, forest on
slopes > 10% |
81
 |
2,000 / 12

|
15
 |
X |
| current |
63
 |
1,300 / 8
 |
4
 |
grains on steep slopes add to erosion - possible error in LU?
|
| model-based,
forest/dense grass where A>10 |
58
 |
200 / 1.2

|
0.1

|
almost the same % of agriculture as current, but some are in too small patches
|
Computed with
 GRASS5
under LINUX using
modified USLE3D and
USPED models
and data from USGS and
ILGIS
GRASS5
under LINUX using
modified USLE3D and
USPED models
and data from USGS and
ILGIS
Comments - the results of the modeling effort indicate that:
1. This area has a very good, conservation oriented land use pattern
(e.g. compare current land use with "buffers only" scenario).
2. Soil loss can be further reduced by focusing on headwater areas and
areas with concentrated flow (possible gullies, interminent streams)
3. Rules for conservation areas which include both distance from stream
and slope steepness are good, however they miss headwaters and concentrated
flow.
4. Stream buffers based only on a distance from larger streams do not provide
sufficient protection - terrain configuration has to be considered.
5. Erosion/deposition model (USPED) shows significant deposition in valleys
and hollows (more than what we usually get from the model). Only after increasing
resolution to 5m and smoothing high erosion typical for gullies starts
to show up in the center of depositional areas - this is a technology issue
which needs to be resolved.
6. Modeling spatial distribution of soil detachment and net erosion/deposition
can provide valuable information for science based extension/enhancement
of rules for conservation program if it is used with appropriate field
observations.
Data
To further improve the results and run more sophisticated simulations the following
data are needed:
1. Streams 1:24,000 or better
2. Current land use at 10m resolution
3. Average C-factors for different land uses
4. Soil map with K-factor
5. As always - any type of validation data, observations, photos etc.
For the presented results in digital form email me at helena@gis.uiuc.edu
Additional results (forthcoming)
1. Erosion and erosion/deposition maps for selected land uses based on
DEM computed by RST
2. Results from SIMWE (shows much more water flowing from upland than the model
based on r.flow which gets water trapped in pits)
Things to look at
1. water flow and erosion/deposition especially in streams if
the fields in flat areas are a) drained (RST-based results and SIMWE
indicates that substantial amount of water can be comming from there
into the streams); b) without drainage with water accumulating and
standing in depressions.
This research was supported by the Illinois state agencies and programs:
CFAR, IDNR and the development of methods
was funded by USA CERL and SERDP
Back to GMSL Modeling & Visualization Home Page
![legend[t/ay]](lghusle.gif)
![legend[t/ay]](lgusped.gif)