GRASS GIS 7:
Spatiotemporal Analytics and Visualization
Helena Mitasova, Anna Petrasova, Vaclav Petras, Brendan Harmon
Center for Geospatial Analytics, North Carolina State University

GRASS GIS: geospatial research platform
grass.osgeo.org
- general purpose desktop GIS with updated wxPython GUI
- backend processing for QGIS, R statistics, WebGIS
- powerful geospatial 2D/3D raster, imagery and vector processing
- single integrated software with 30 years of development
GRASS GIS 7: Spatiotemporal 3D GIS
- Temporal framework for large raster and vector time series
- 2D and 3D dynamic visualization
- pyGRASS: python interface to the GRASS C library
- spgrass7 for coupling with R
- 350+ core modules and rapidly growing add-ons contributed by the community
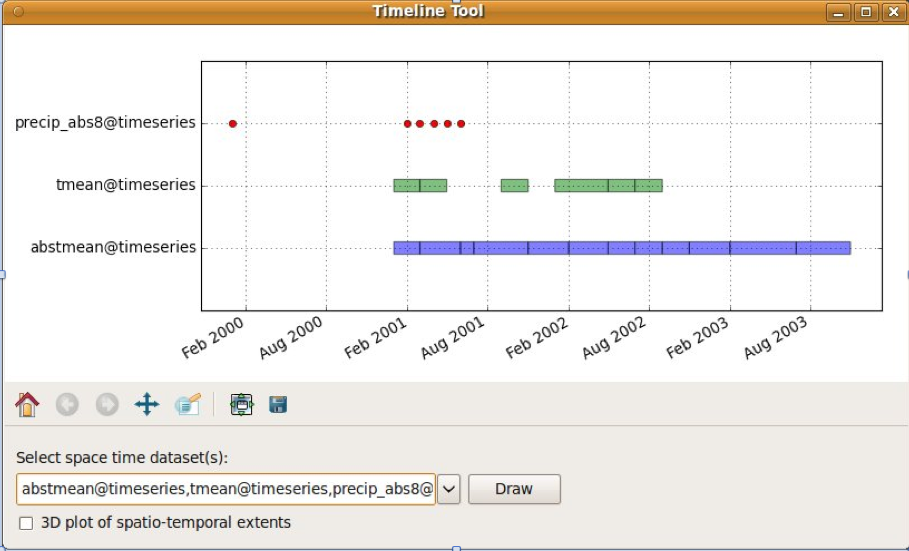
Space-Time Framework: Analysis
- New time series datatypes: Space-time raster, 3D raster and vector
- Time series datasets managed in temporal database
- New modules: query, aggregation, conversion, statistics, gap filling

North Carolina climate data analysis
Gebbert, S., Pebesma, E., 2014. TGRASS: A temporal GIS for field based environmental modeling. Environmental Modelling & Software 53, 1-12.
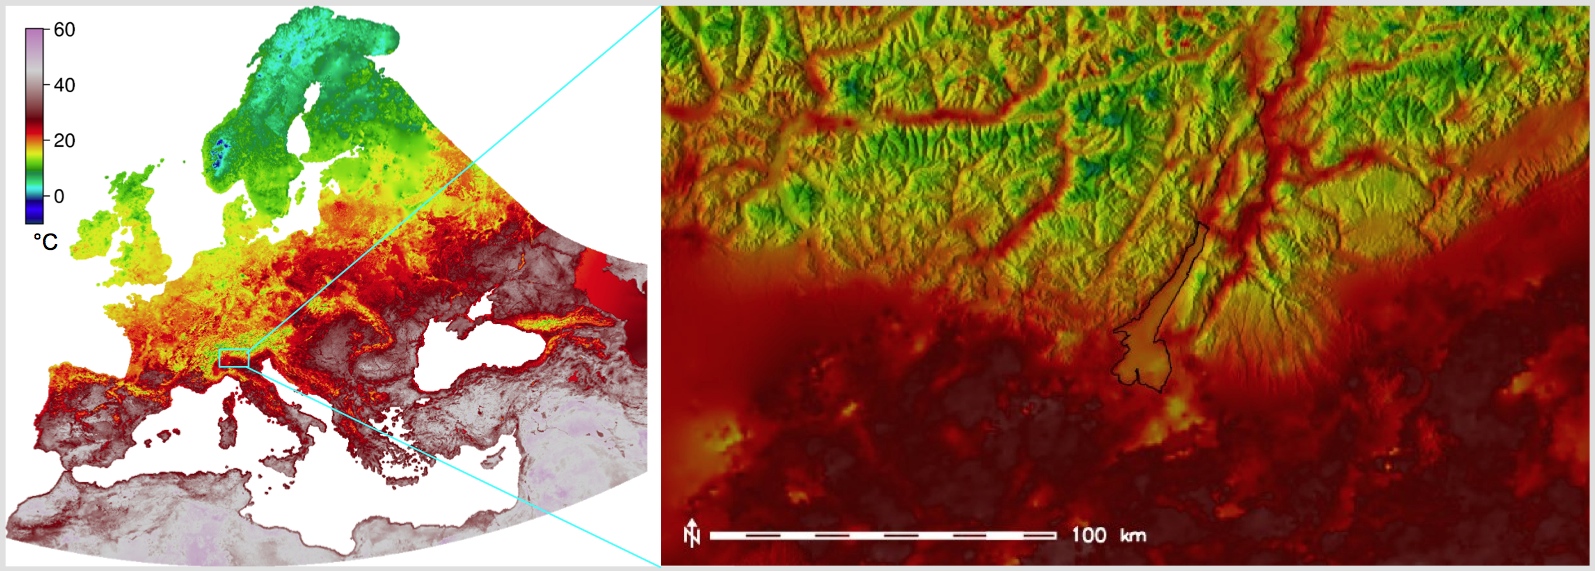
MODIS land surface temperature time series
- 14 years of 4-times per day data (14x1440 maps) for entire Europe at 250m resolution
- advanced statistical methods used to fill no-data areas and enhance resolution
- multivariate regression including elevation, solar angle, annual precipitation
- EuroLST: http://gis.cri.fmach.it/eurolst/
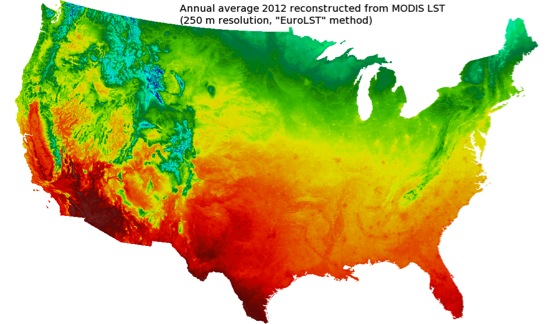
MODIS land surface temperature US
- LST method applied to US
- Metz, Rocchini, Neteler, 2014: Rem Sens, 6(5): 3822-3840
Space-Time Framework: Visualization
- Simultaneous 2D, 3D dynamic visualization
- Space-time cube voxel models


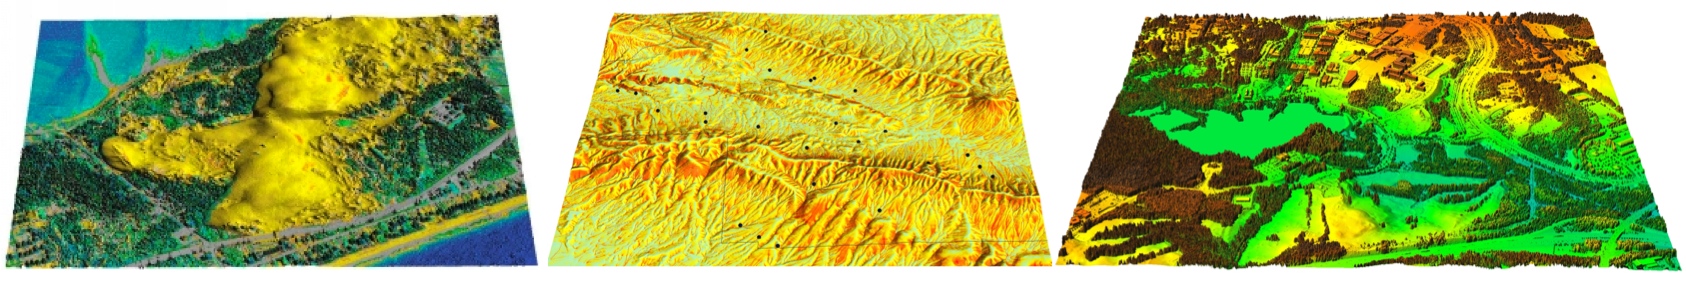
Coastal DEM time series visualization
DEM time series visualization:
Jockey's Ridge migration 1974 - 2012


Space-Time Cube visualization:
Jockey's Ridge 16m, 20m contour evolution isosurfaces
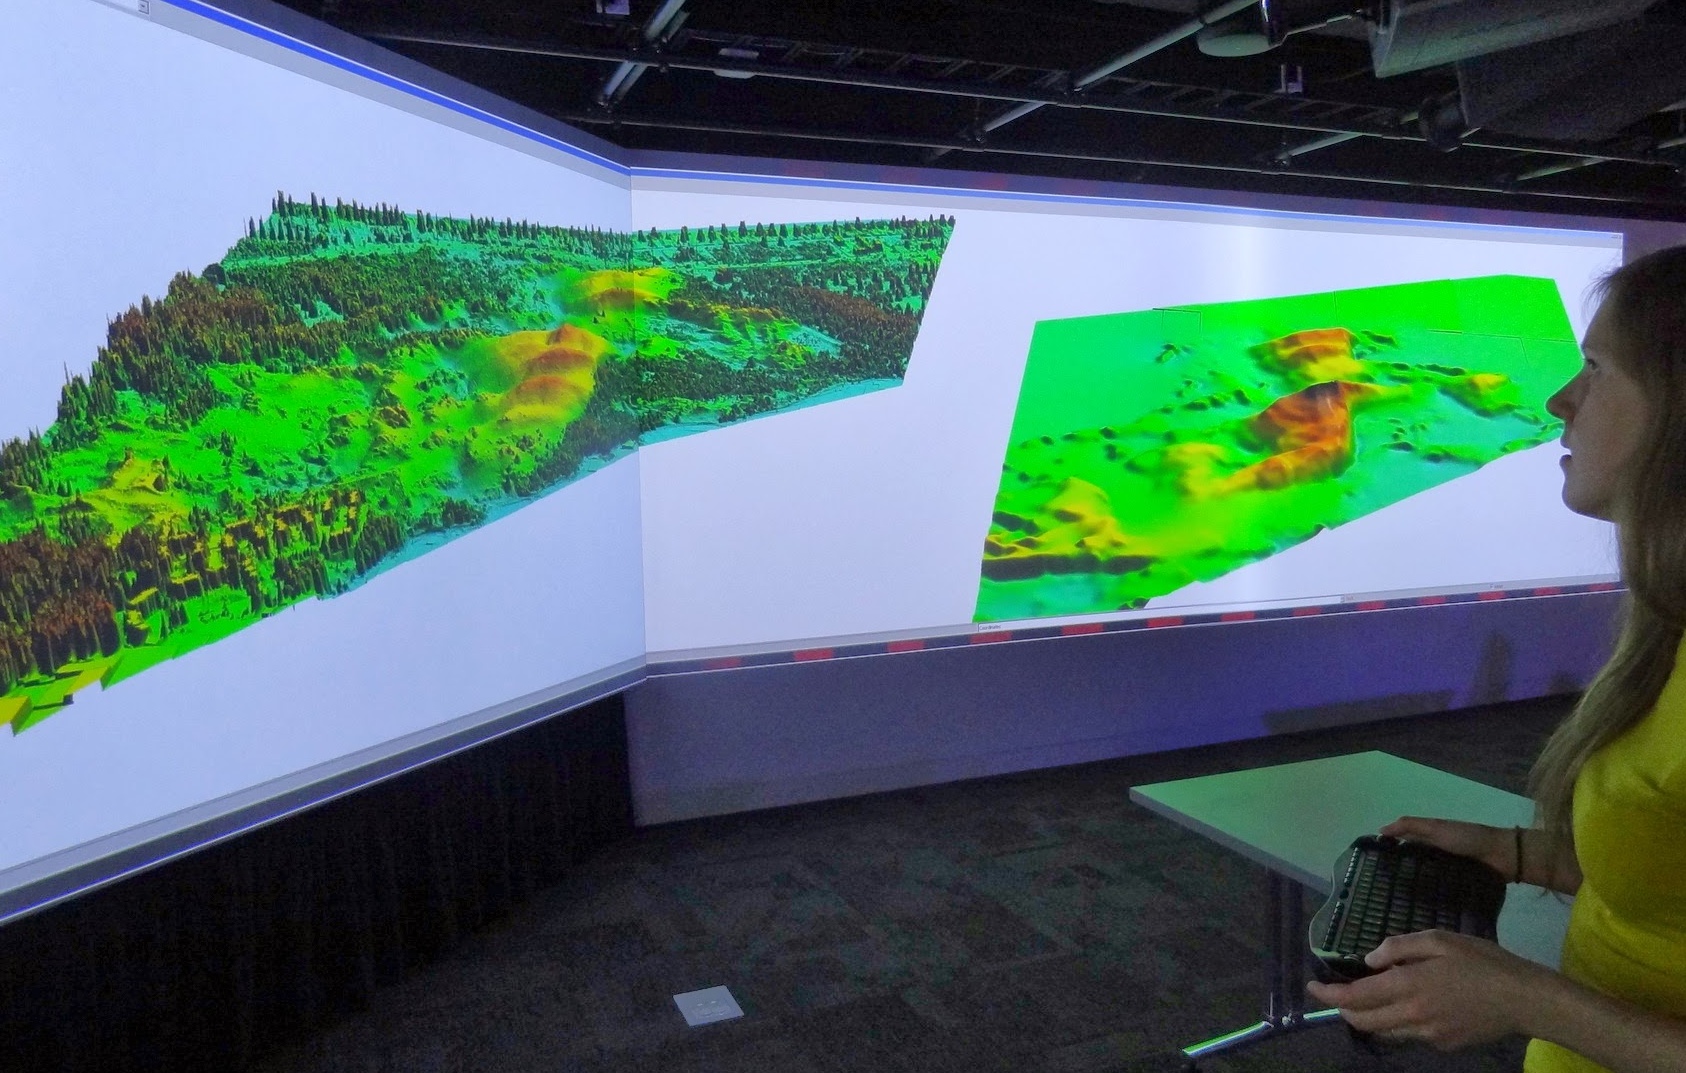
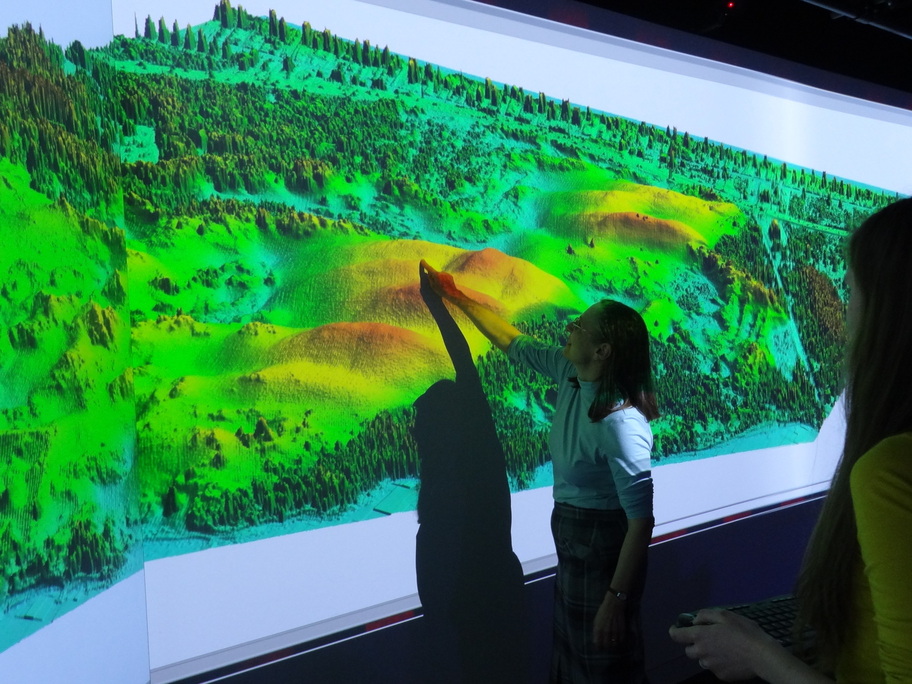
Interactive 270 degree visualization
Jockey's Ridge visualization in the Hunt Library teaching and visualization laboratory
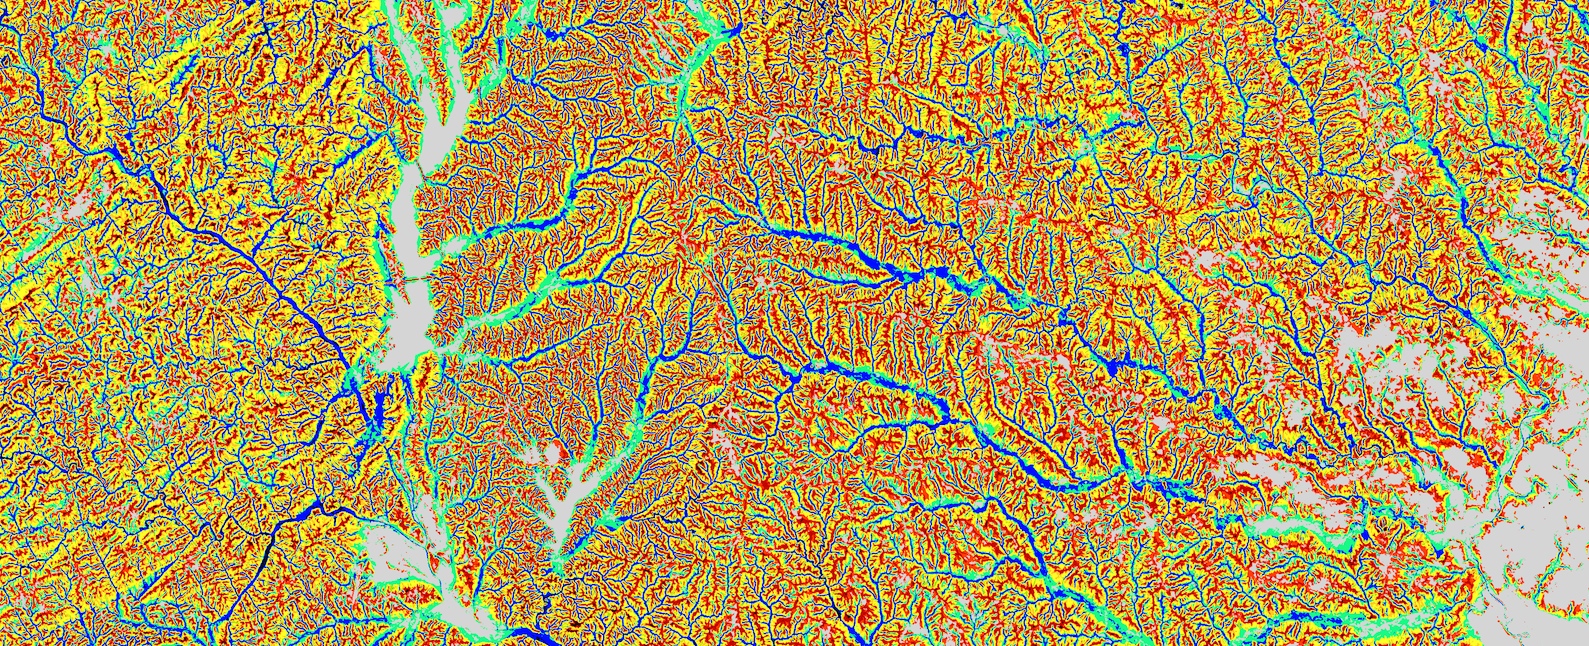
On-line geospatial analytics:
Geomorphons
Basic landforms extracted for the entire US
Interactive search of landuse patterns, and patterns of landuse change
Spatial Informatics Laboratory, University of Cincinnati
http://sil.uc.edu/
Spatiotemporal modeling of processes
Path sampling method for solving the flow continuity equations
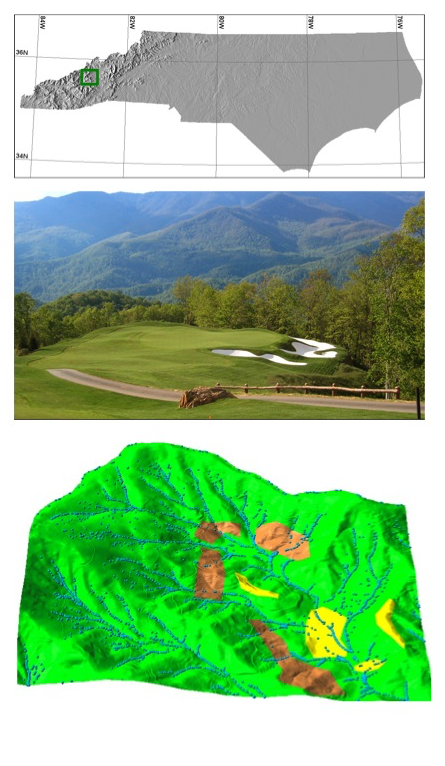
UAS data acquisition for high resolution modeling
- NGAT Trimble UX5 system at NCSU Lake Wheeler experimental farms
- Orthophoto (3cm res.) draped over a Digital Surface Model (DSM, 15cm res.)
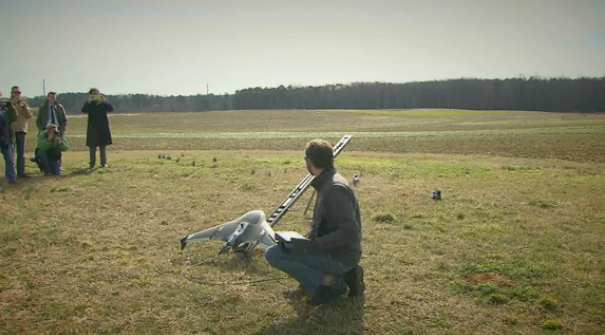
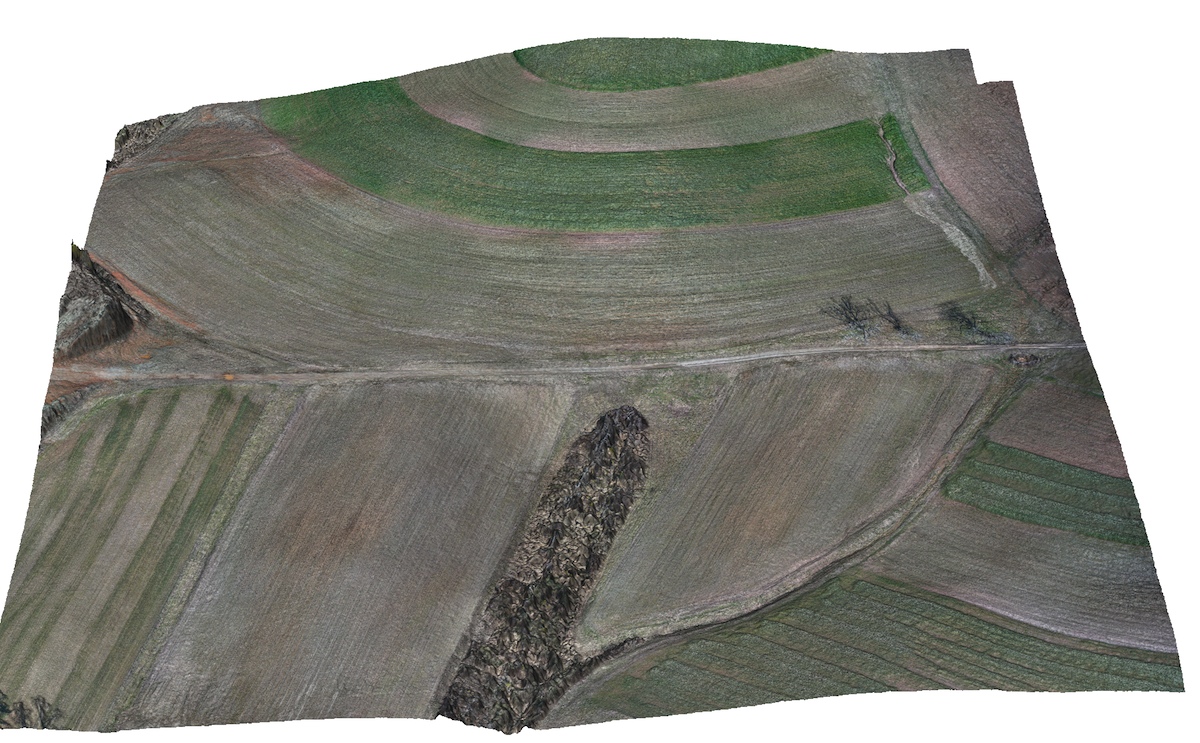
Data acquired by NCSU NGAT, processed by Justyna Jeziorska, U. Wroclaw
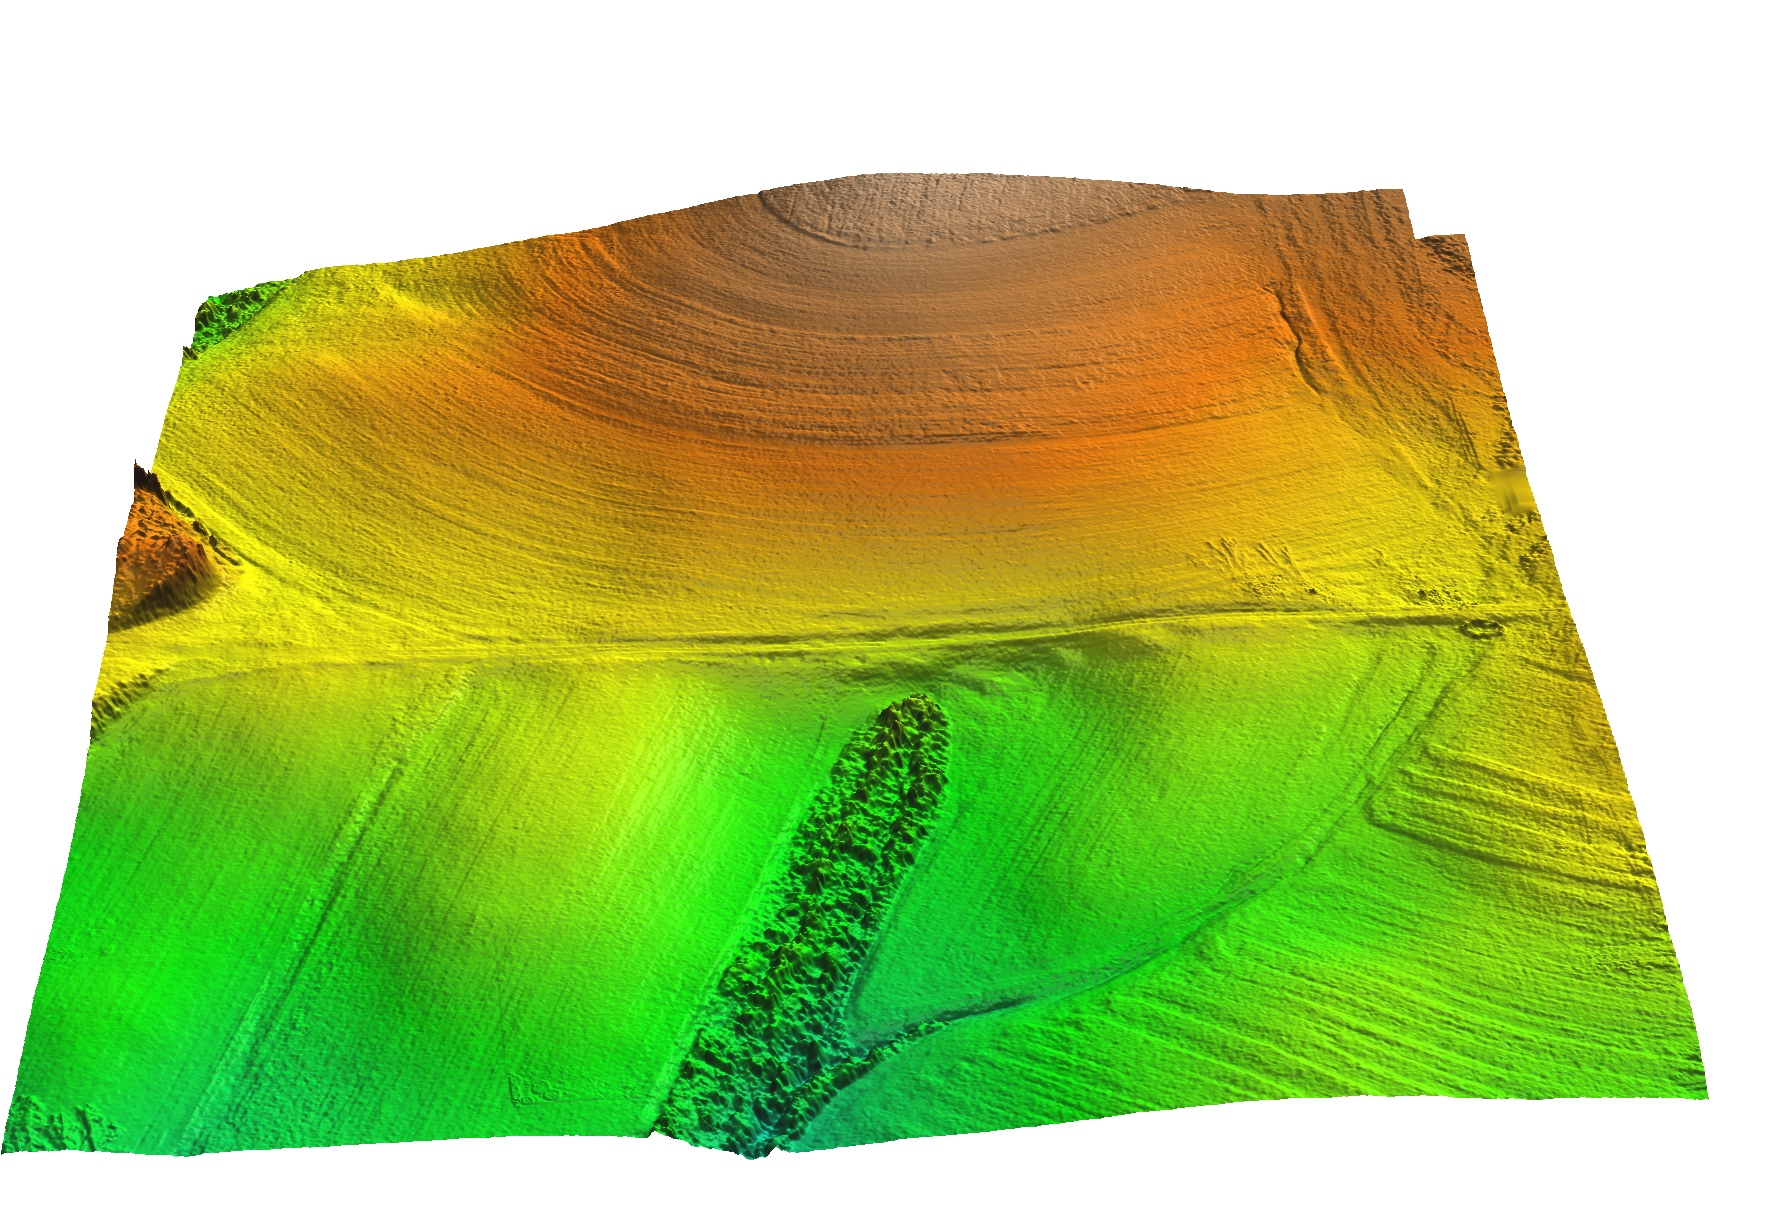
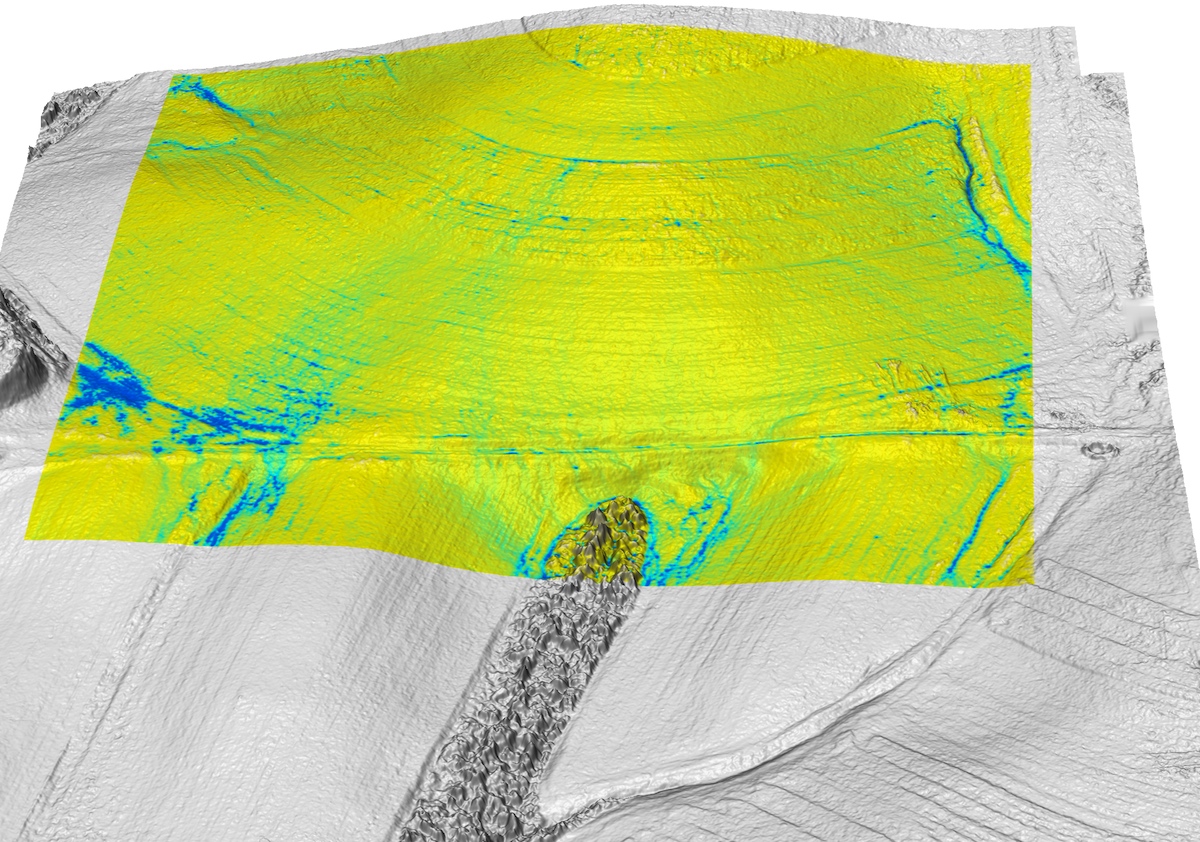
UAS DSM and water flow modeling
- DSM of tilled fields at NCSU Lake Wheeler experimental farms
- Simulated surface water depth captures flow redirection by tillage
Centennial Campus case study
- 3D data acquired by lidar in 2001 and 2013
- used as study area for several courses
- Lidar data processing, surface runoff assessment, trails planning
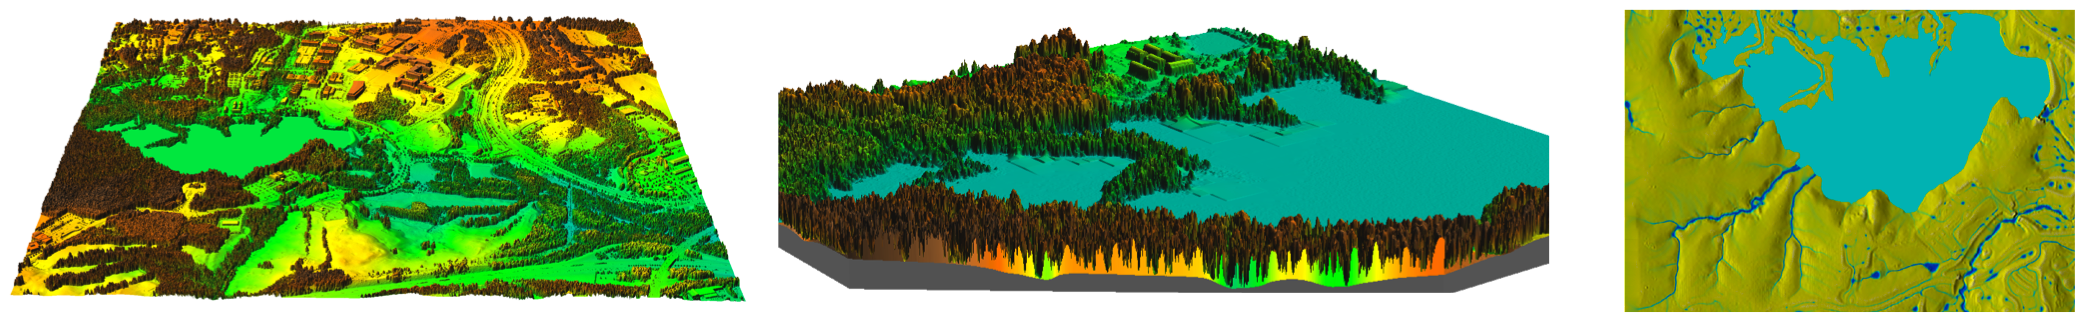
Centennial Campus
Solar radiation modeling: summer and winter solstice dynamics

Centennial Campus
Fire spread modeling using fuel estimates from lidar data and with a fire break:
Interactive Centennial Campus

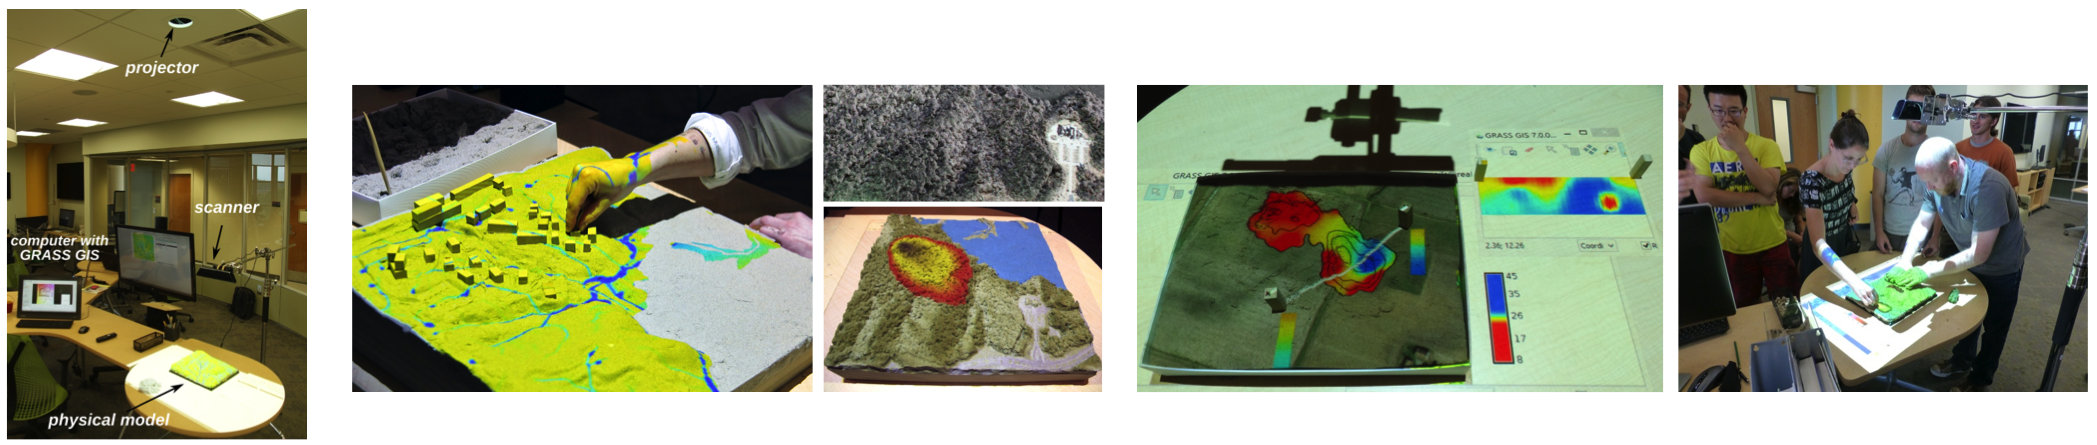
Tangible landscape: overview
Exhibition booth 27 and 35
NCSU OSGeoREL
geospatial.ncsu.edu/osgeorel/
- NCSU Open Source Geospatial Research and Education Laboratory
- Member of Geo4all initiative: global network for foss4g education
- 91 labs on all continents
- NCSU NA leading lab: GRASS GIS development, courses, research projects
- GitHub: https://github.com/ncsu-osgeorel