 GeoIS-EM Home
Chagres River Watershed Analysis
GeoIS-EM Home
Chagres River Watershed Analysis
GeoIS-EM Home
Chagres River Watershed Analysis
Helena Mitasova, NCSU
When using the images posted here, please credit this site as:
Mitasova, H. 2003, Chagres River Watershed Analysis,
http://skagit.meas.ncsu.edu/~helena/measwork/panama/panama.html
GIS data processing is performed for the ARO project: Chagres River Tropical Watershed Study
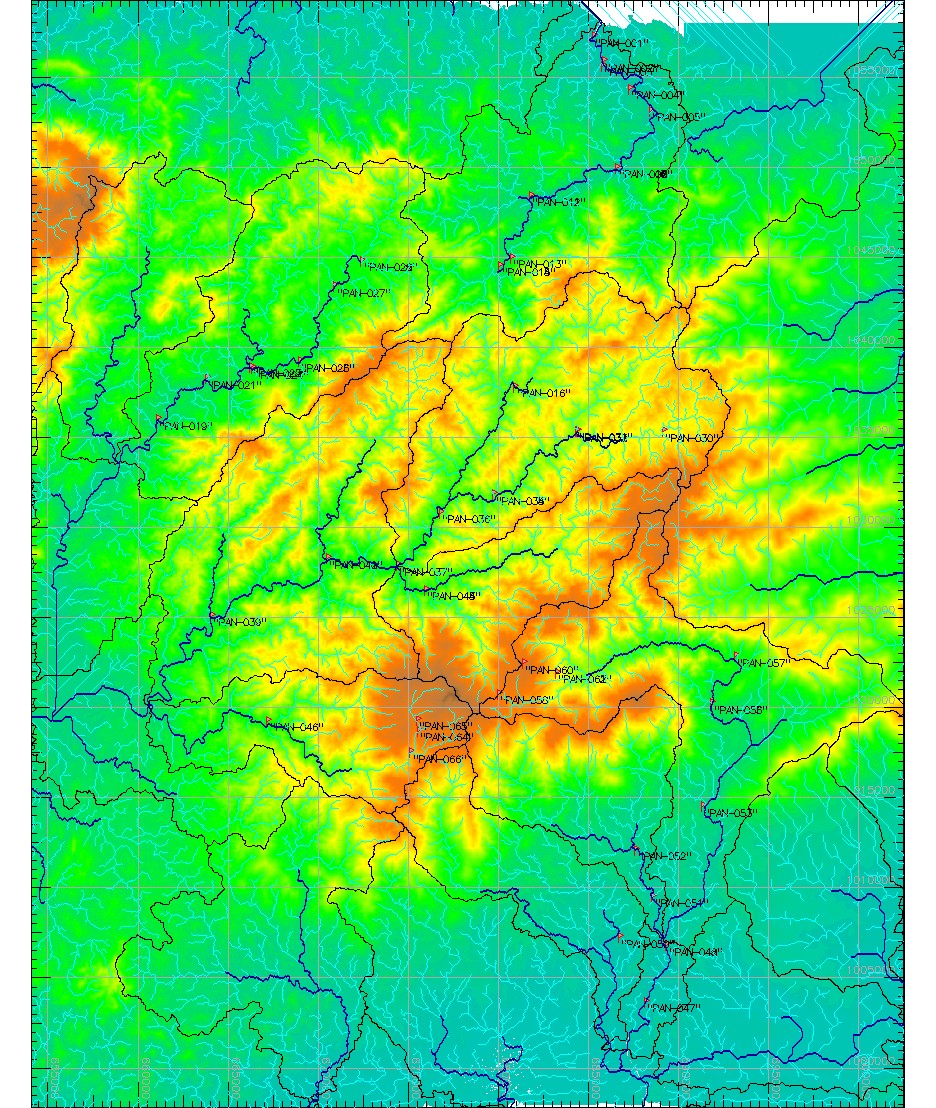
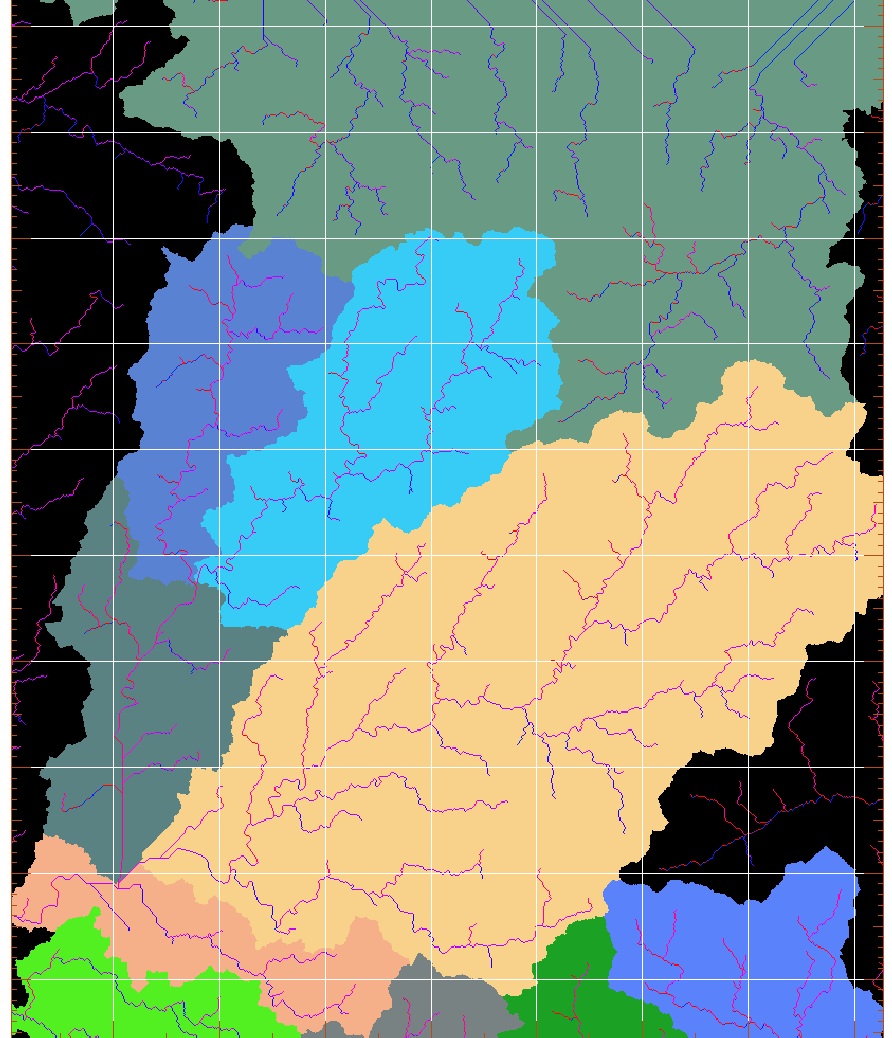
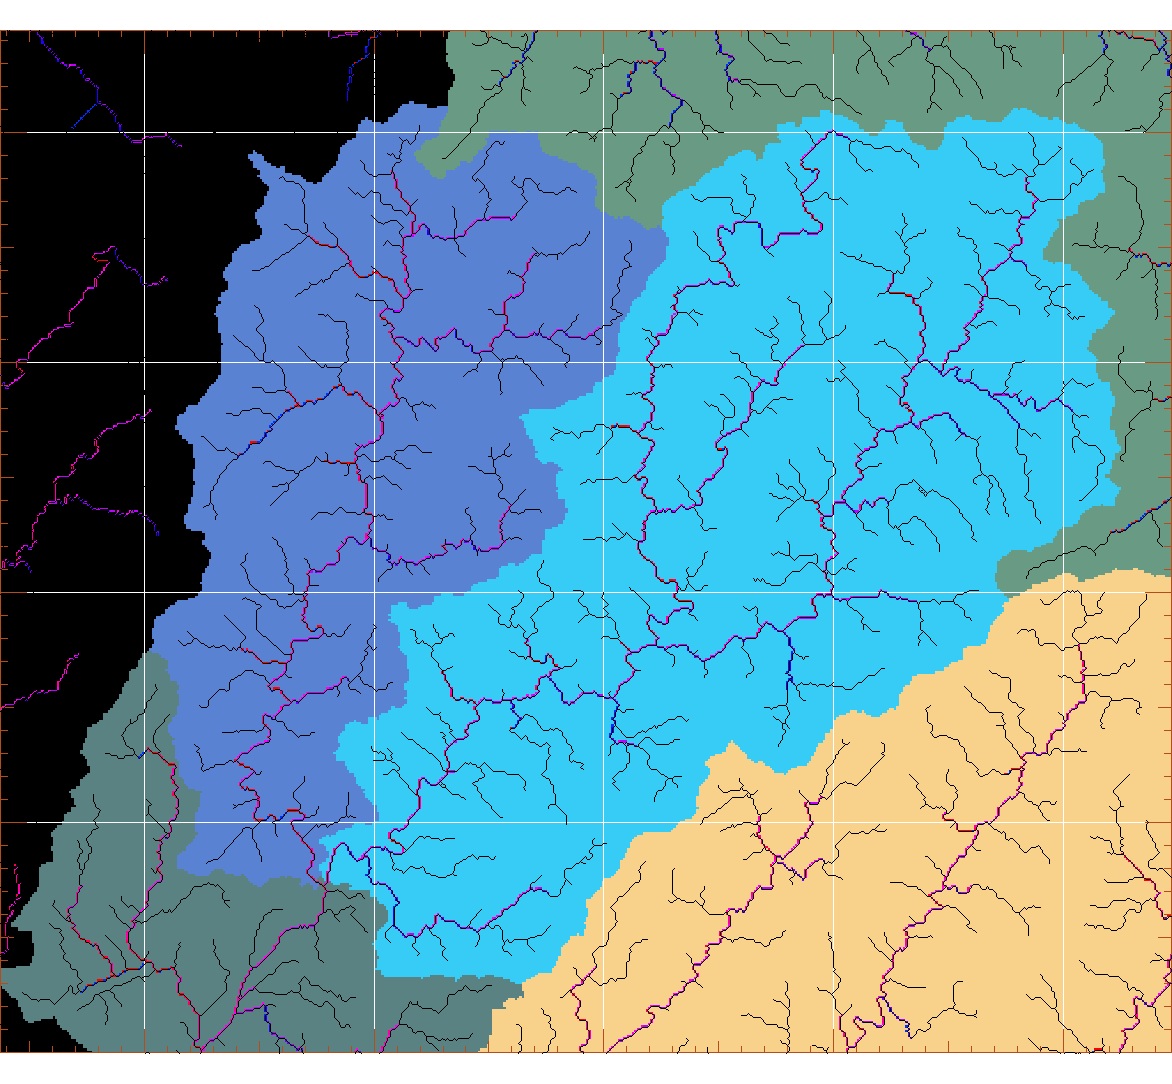
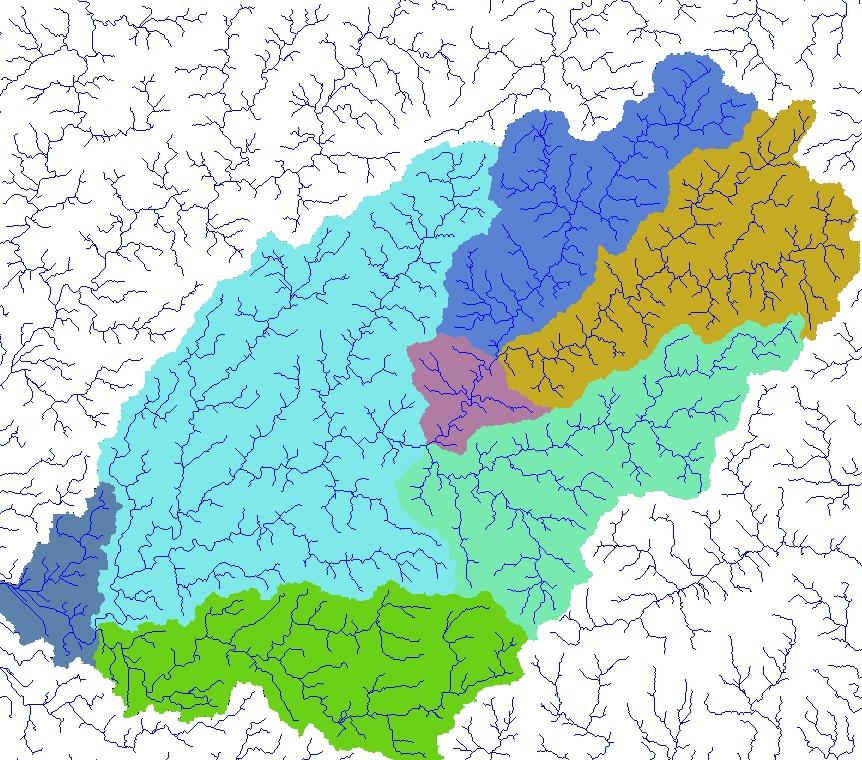
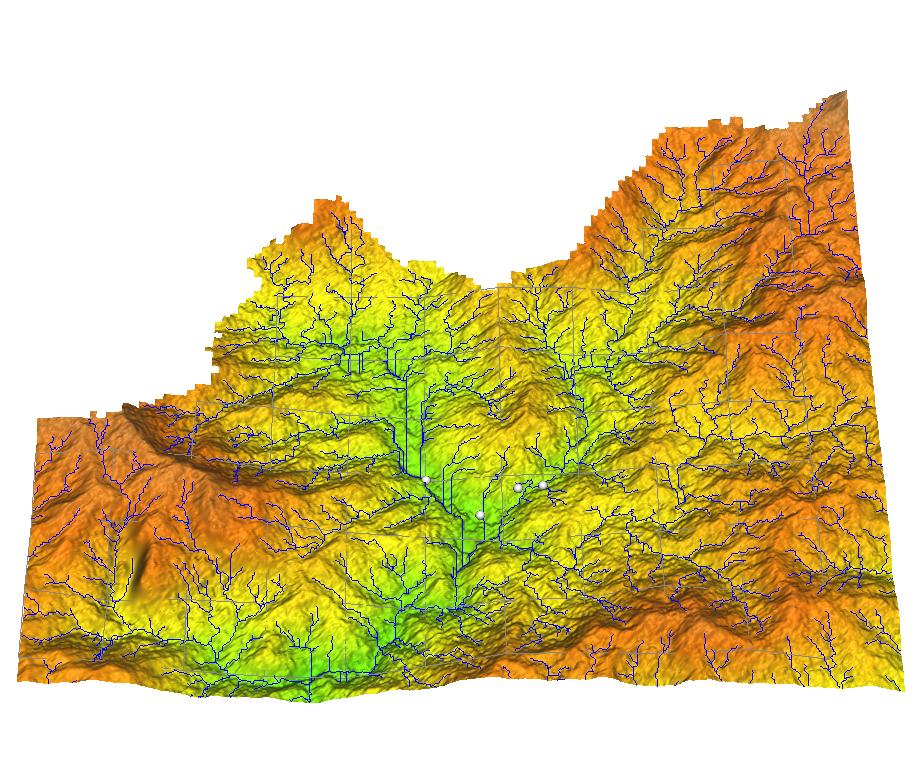
Watershed analysis for Pequeni, Cuango and Pacora basins
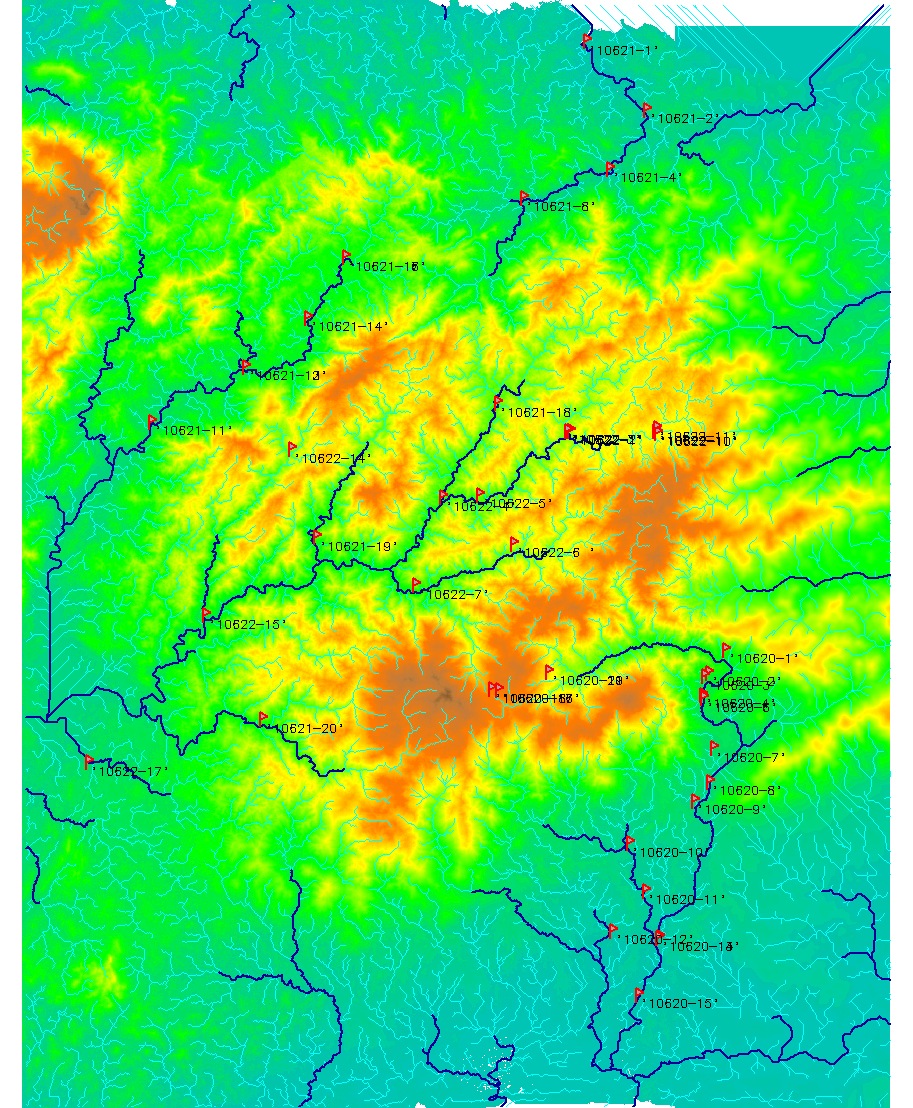
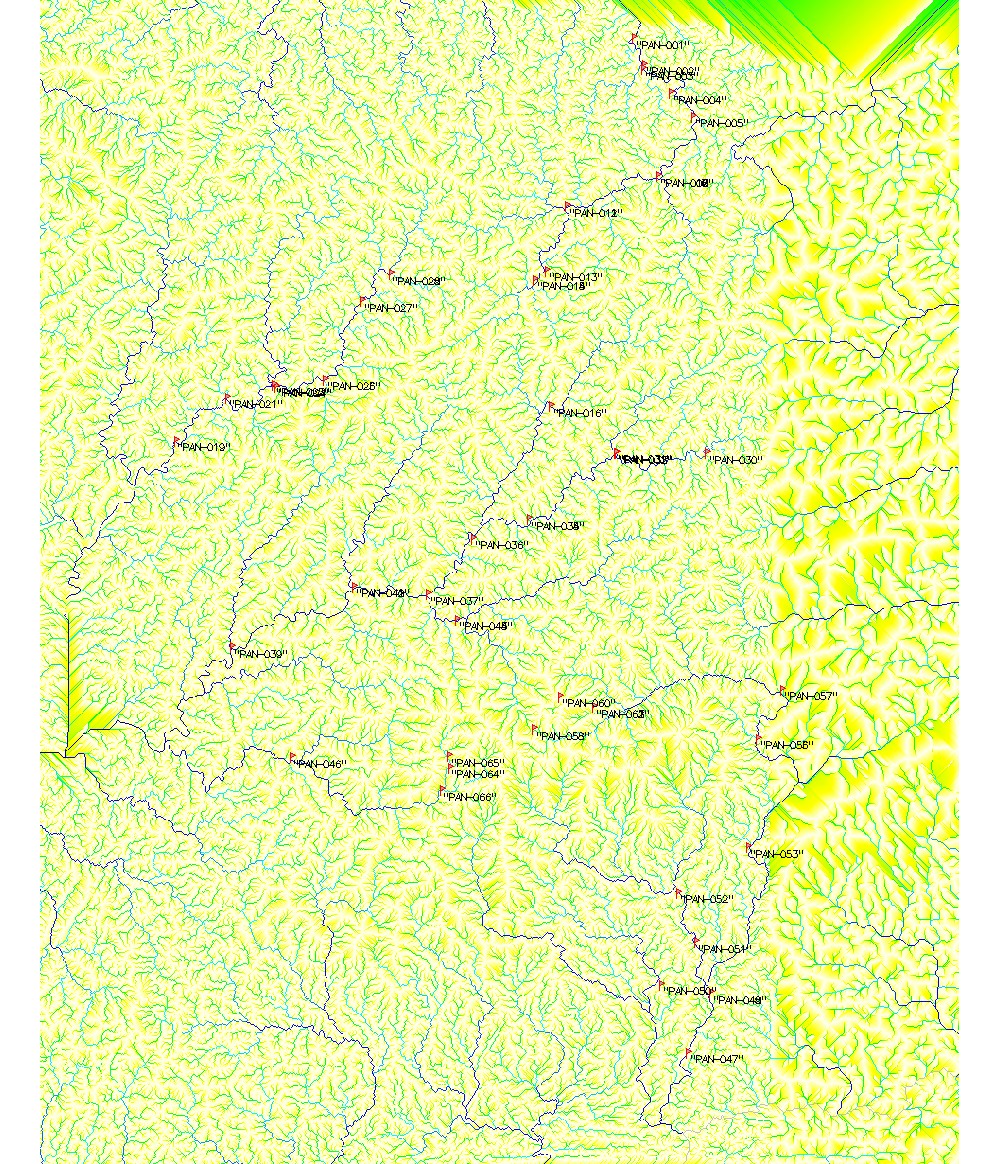
Location of sites sampled in Jan. 2006
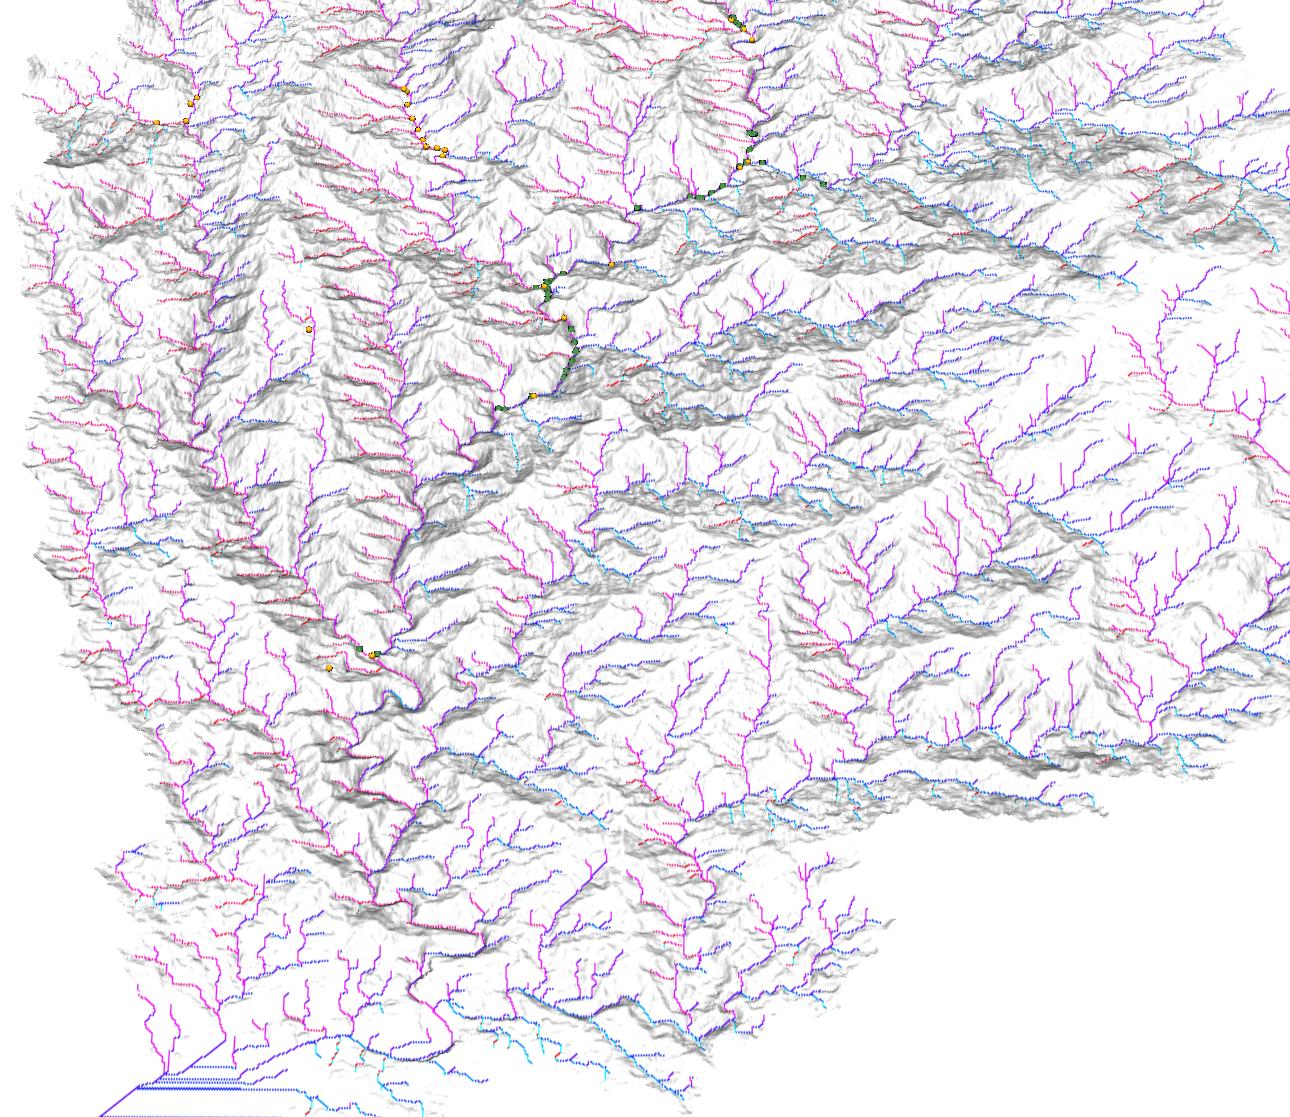
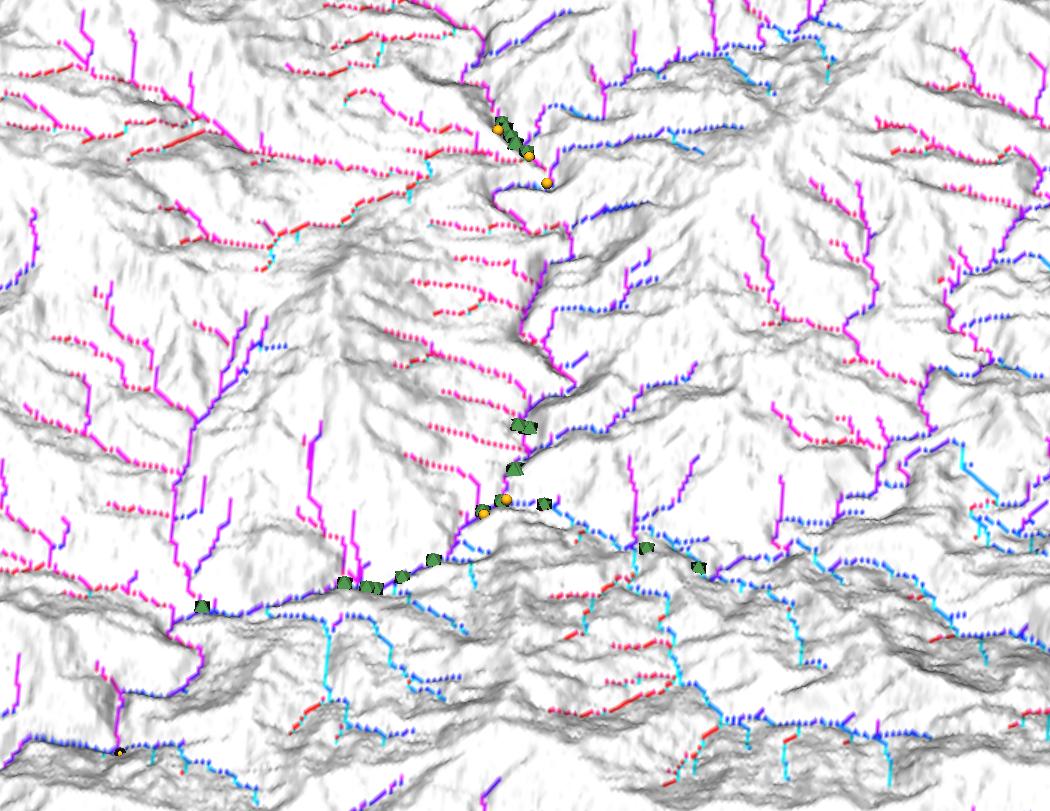
Location of old and new sites sampled
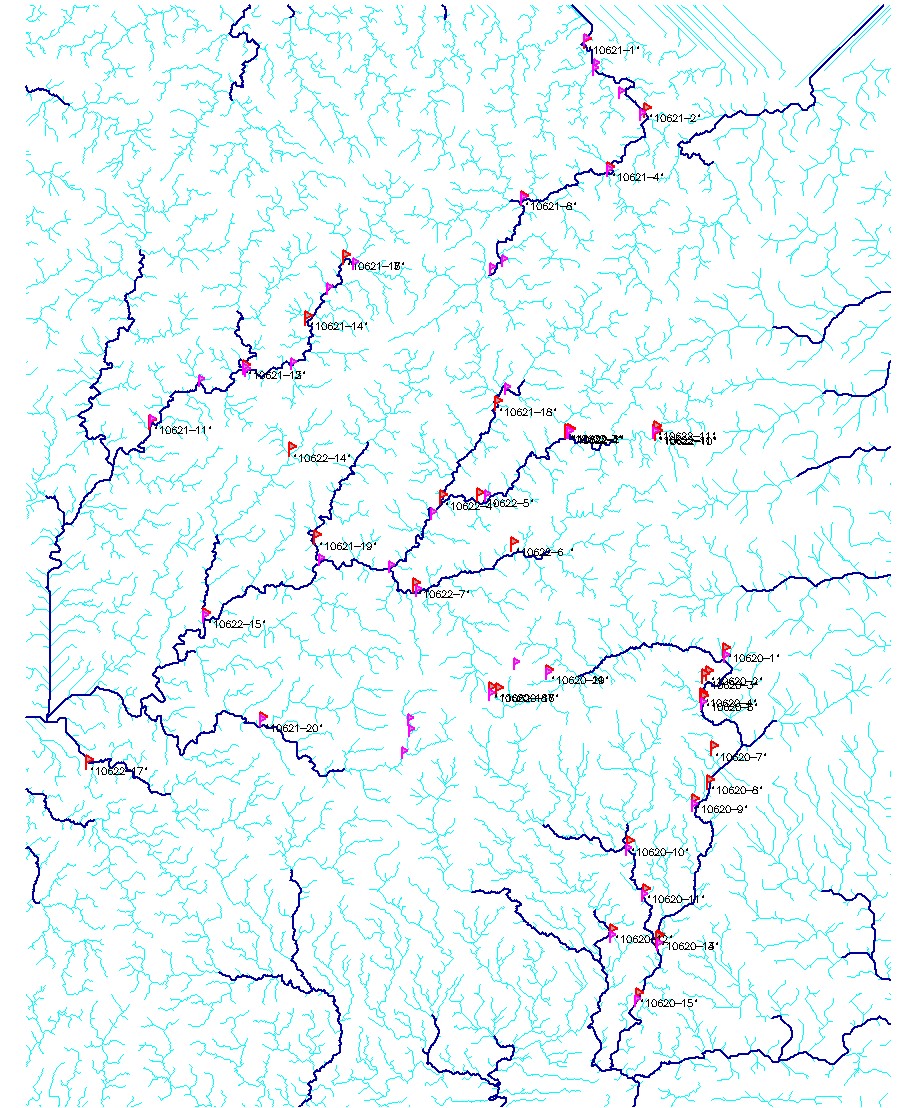
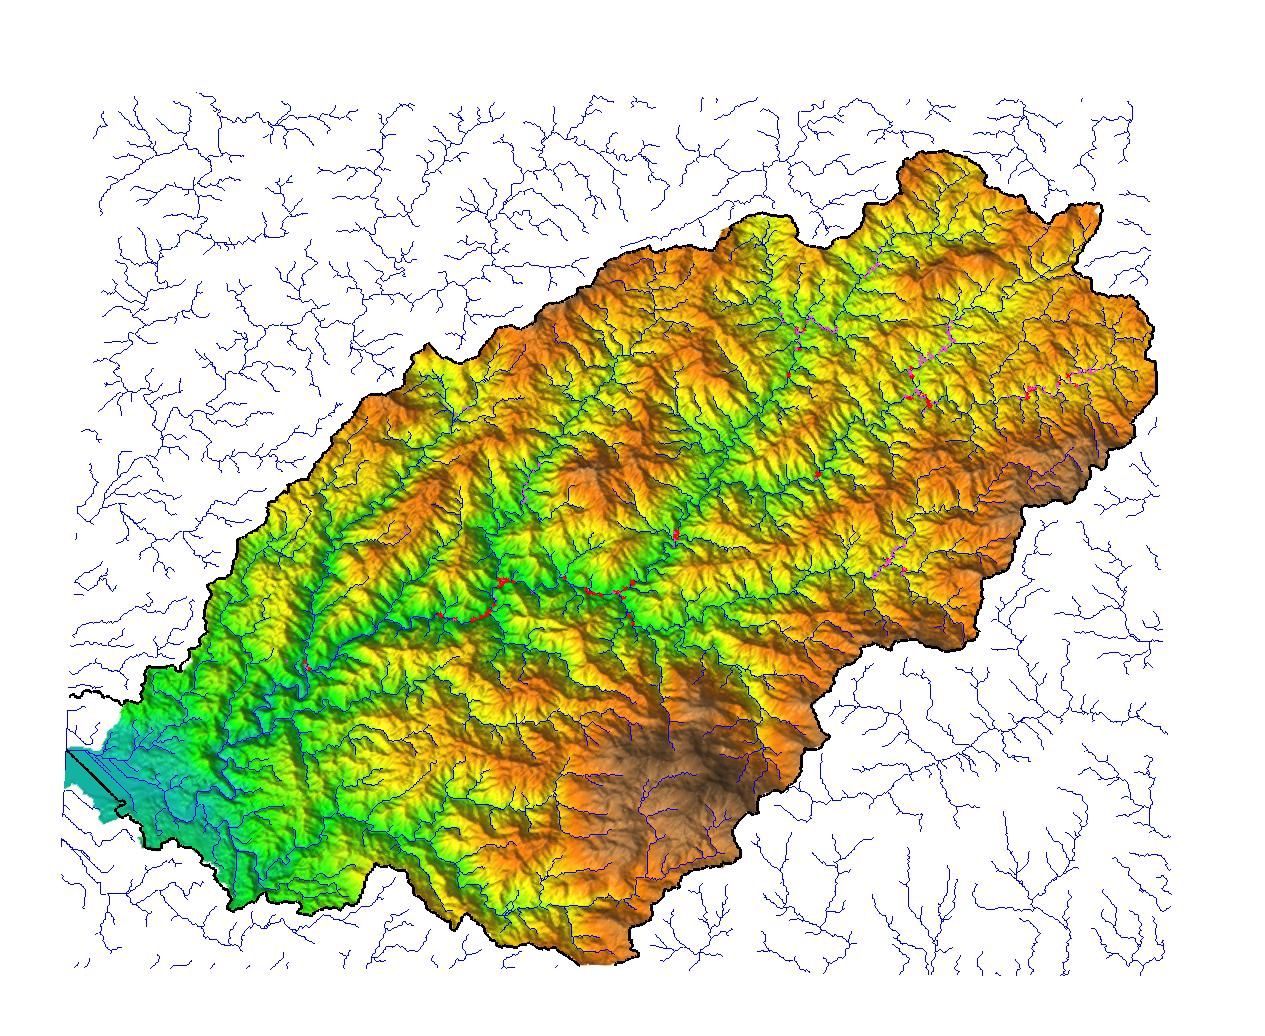
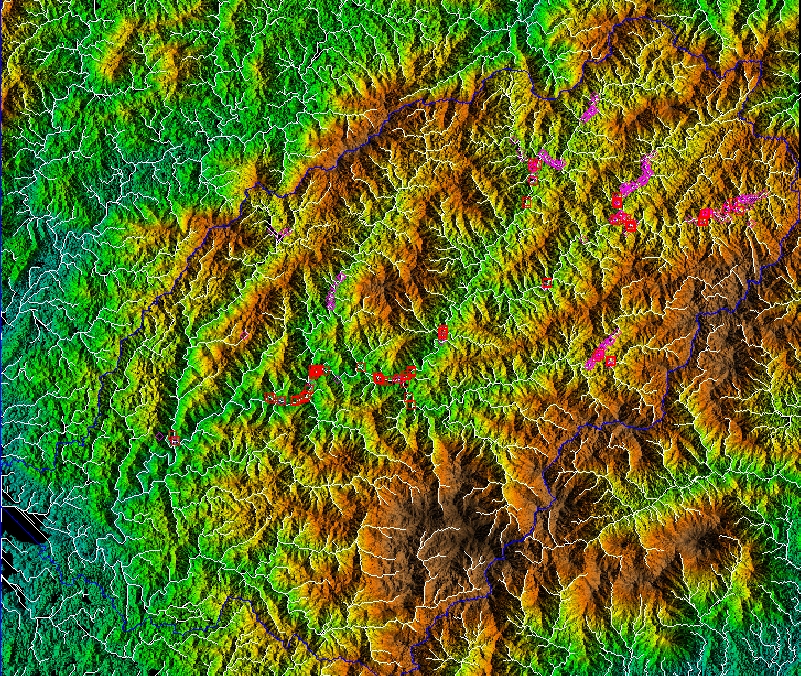
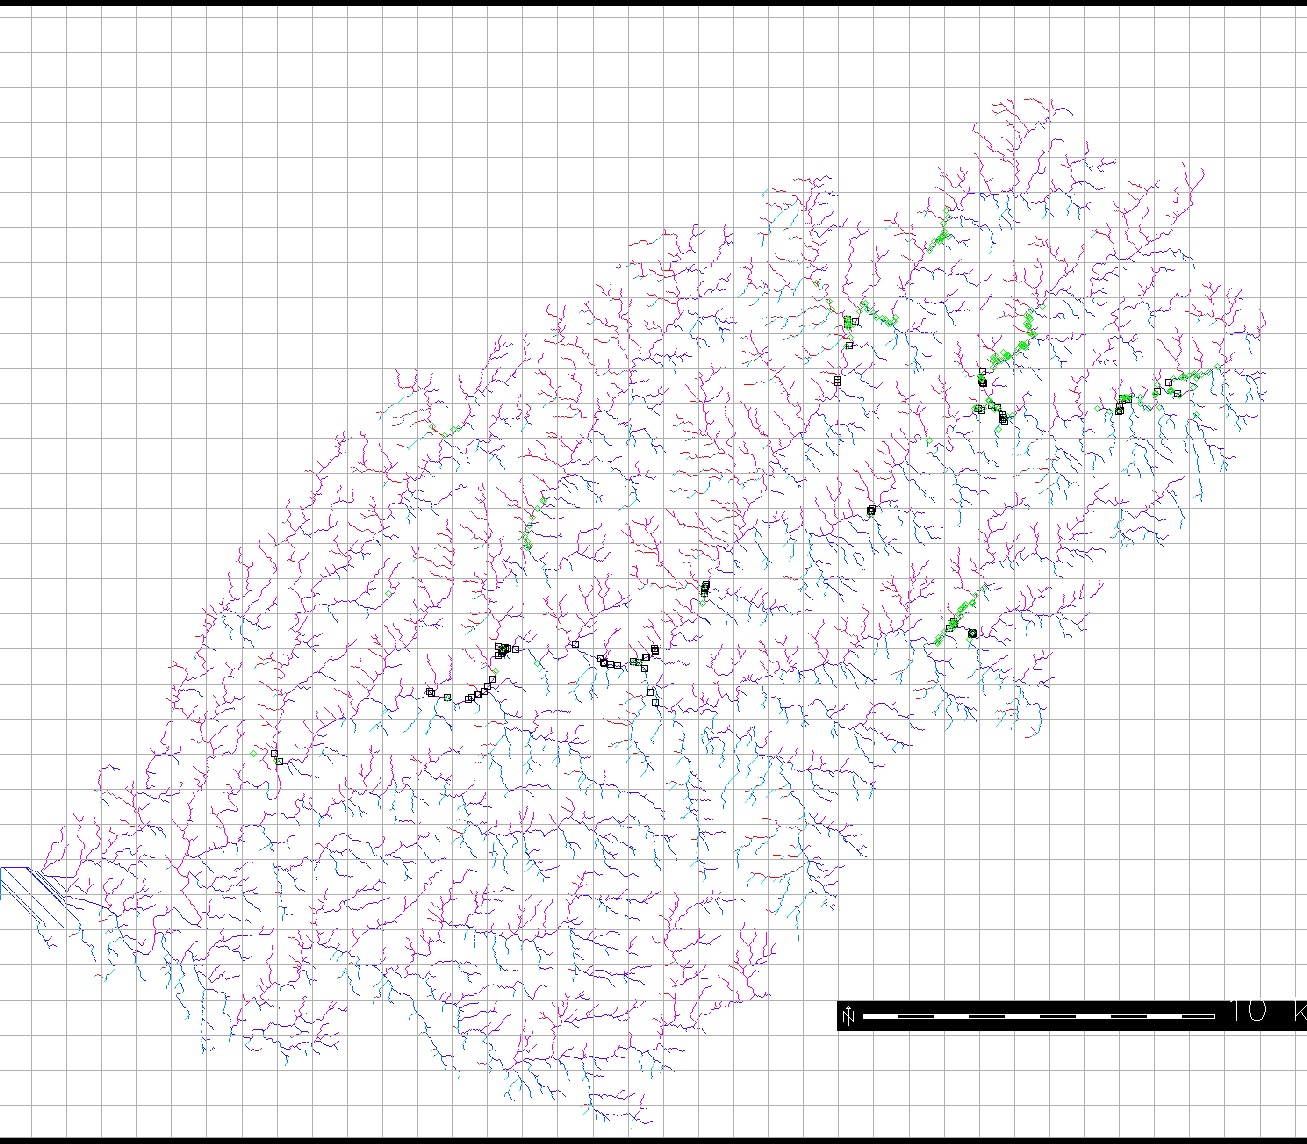
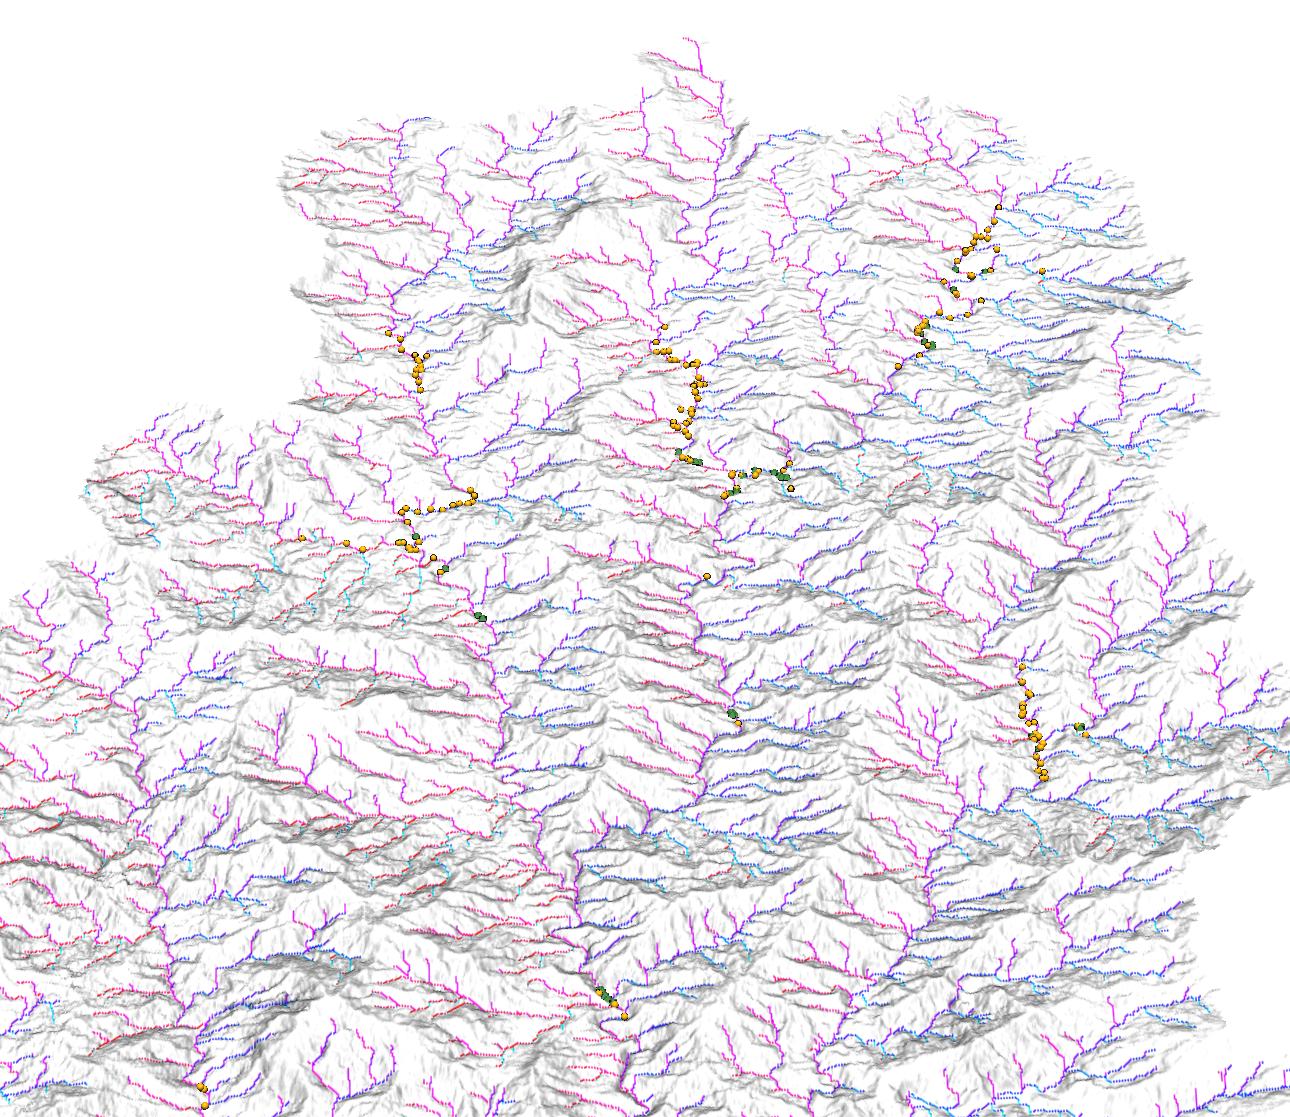
All studied basins and streams; 2005 sites
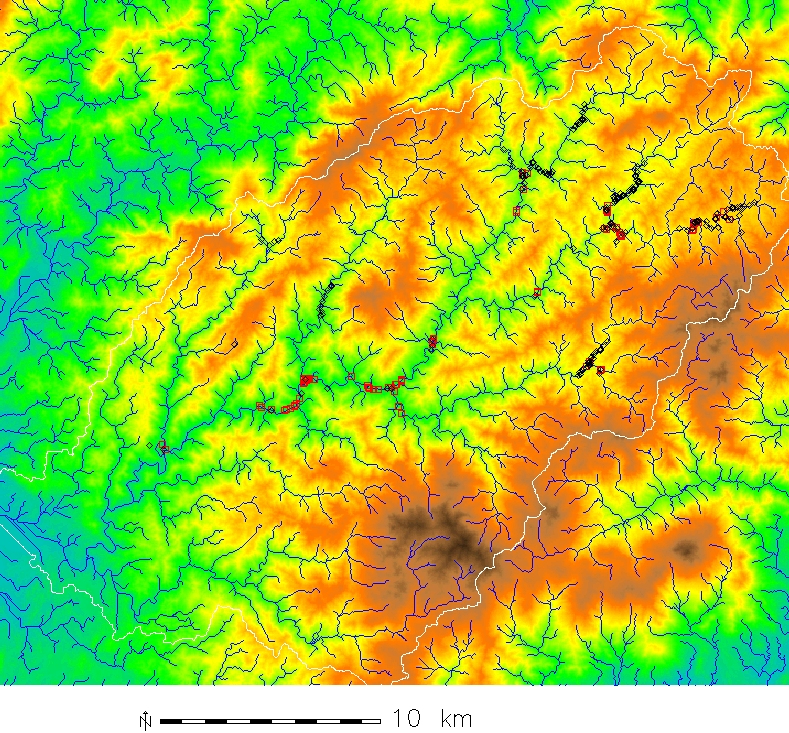
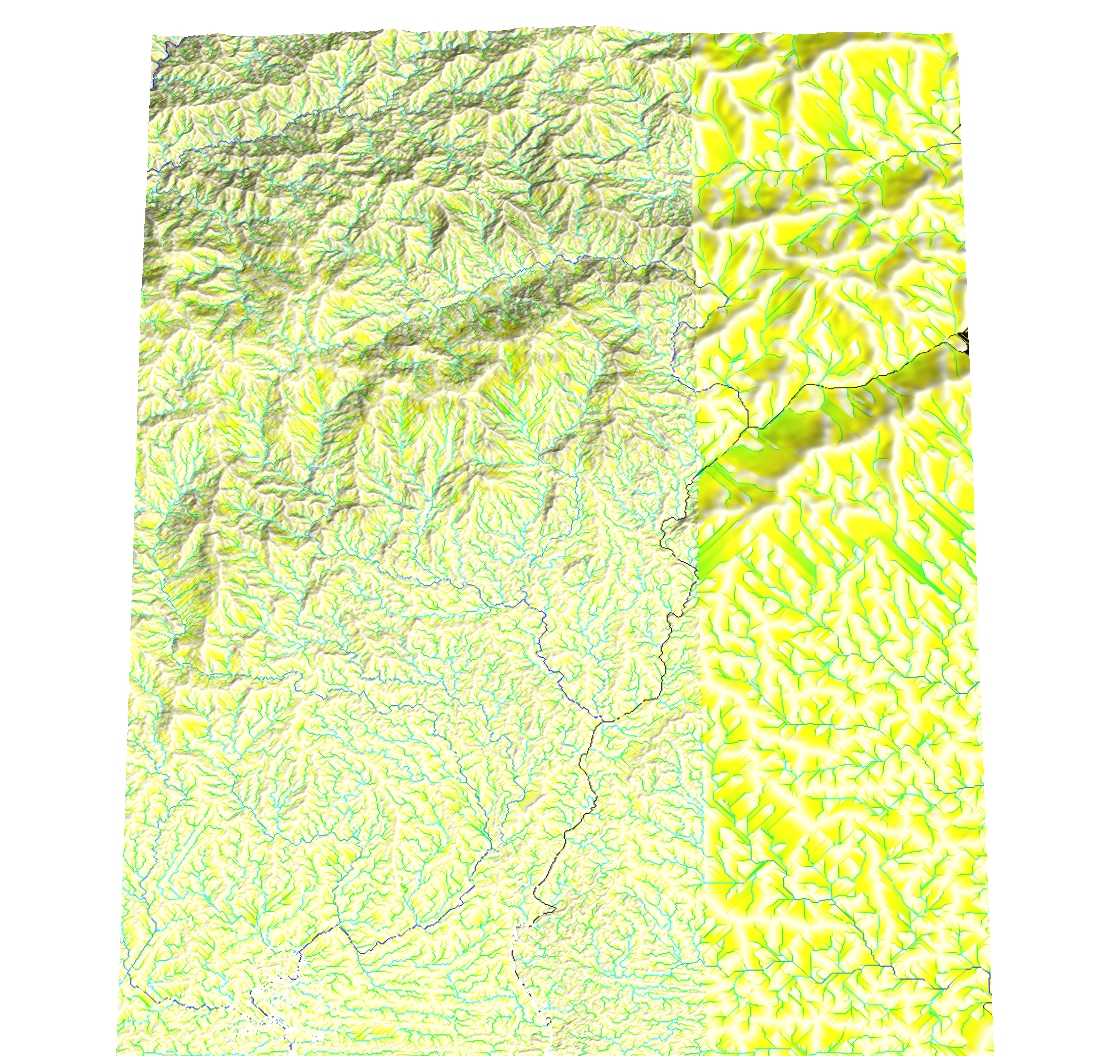
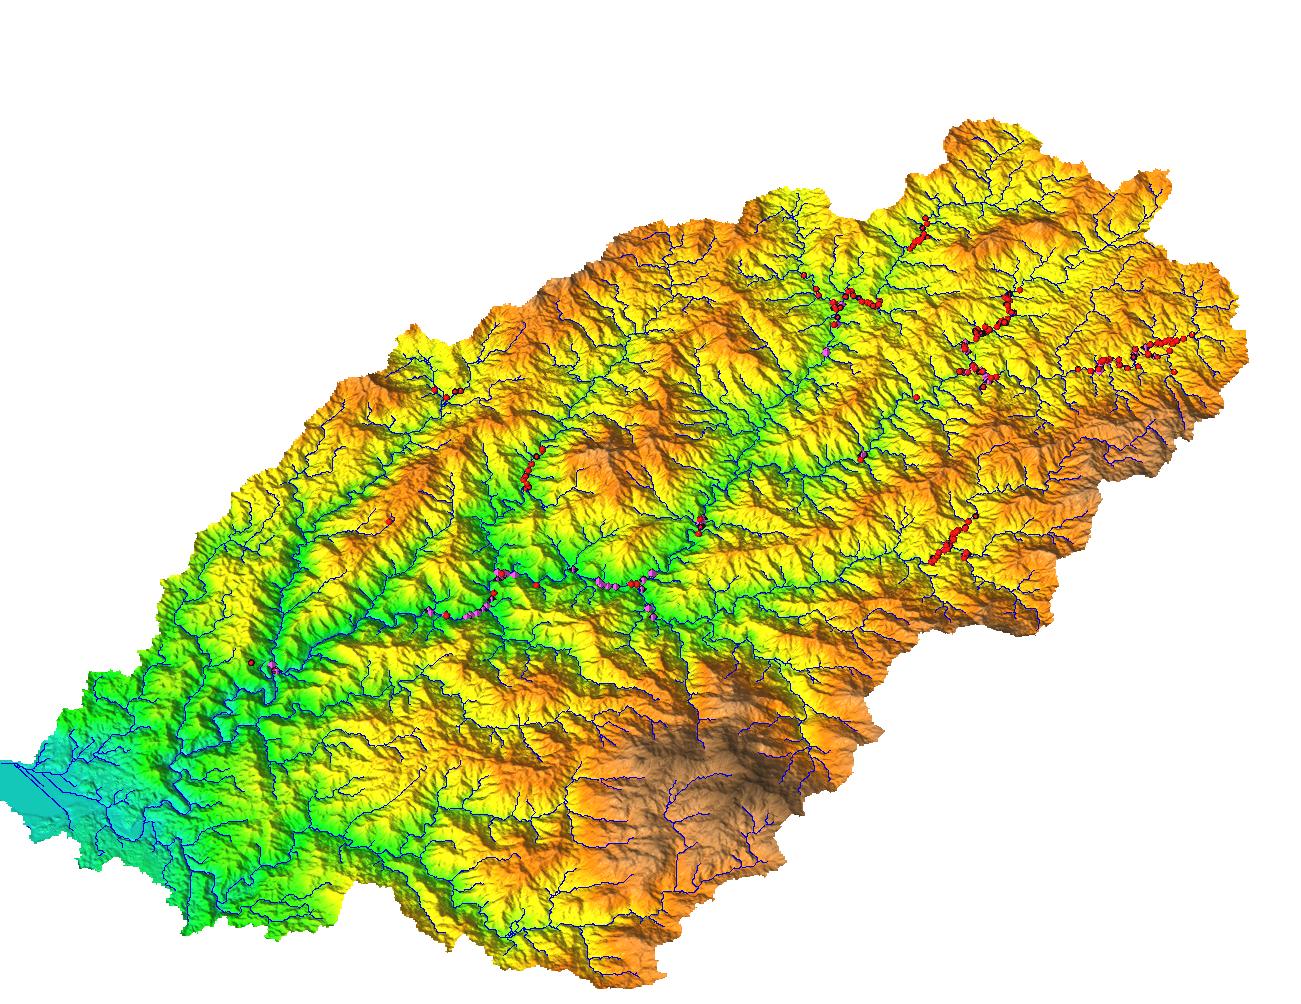
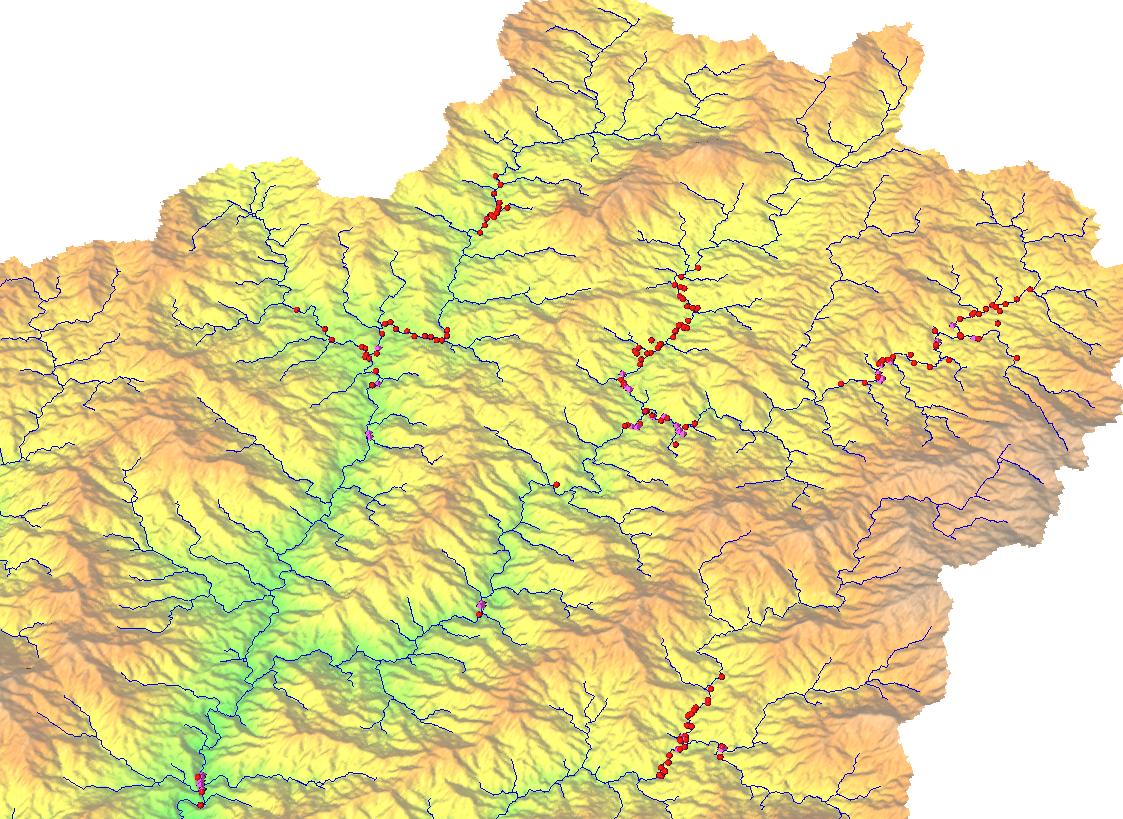
Flowaccumulation and sites for all studied basins
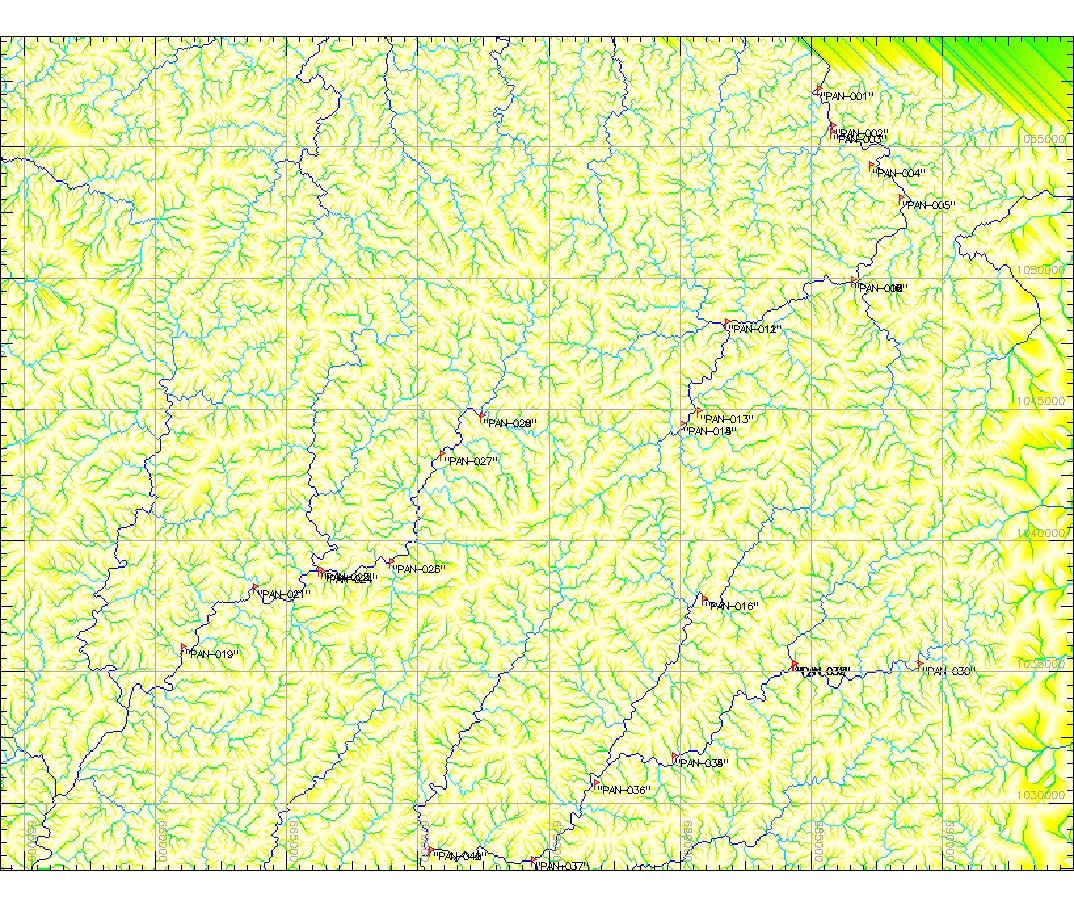
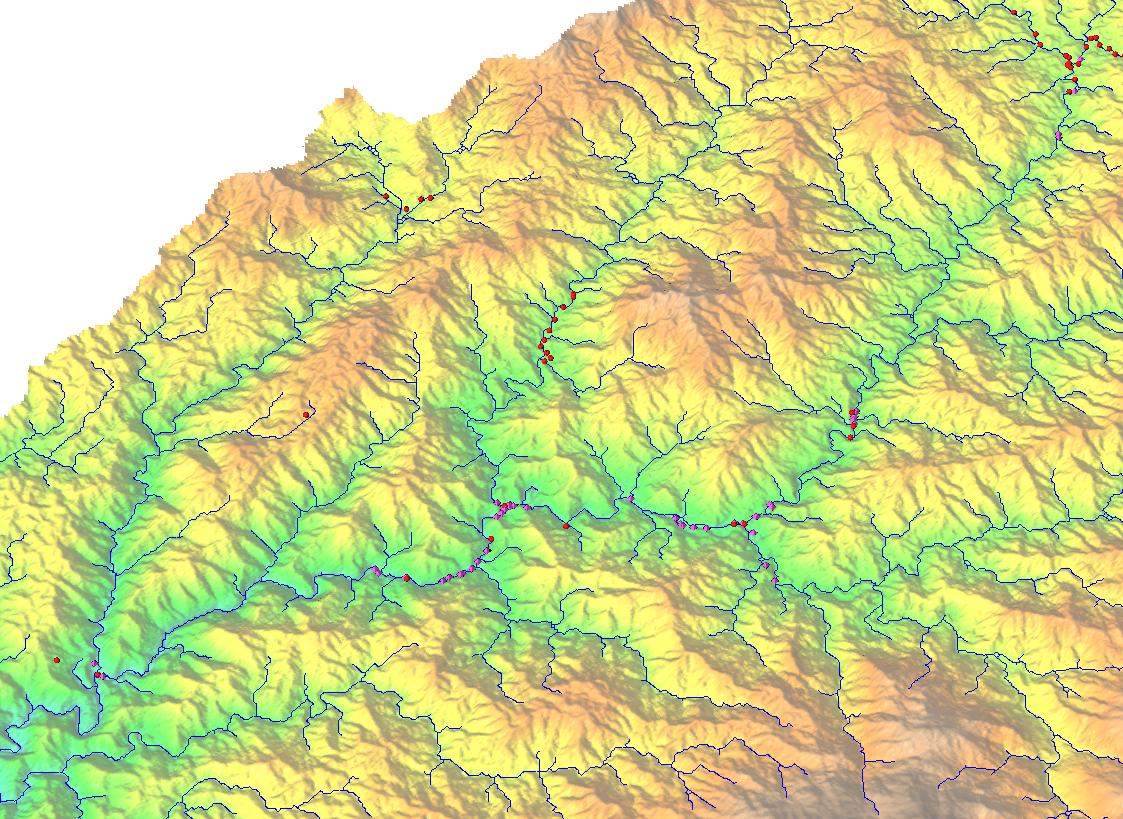
Flowaccumulation and sites for northern basins
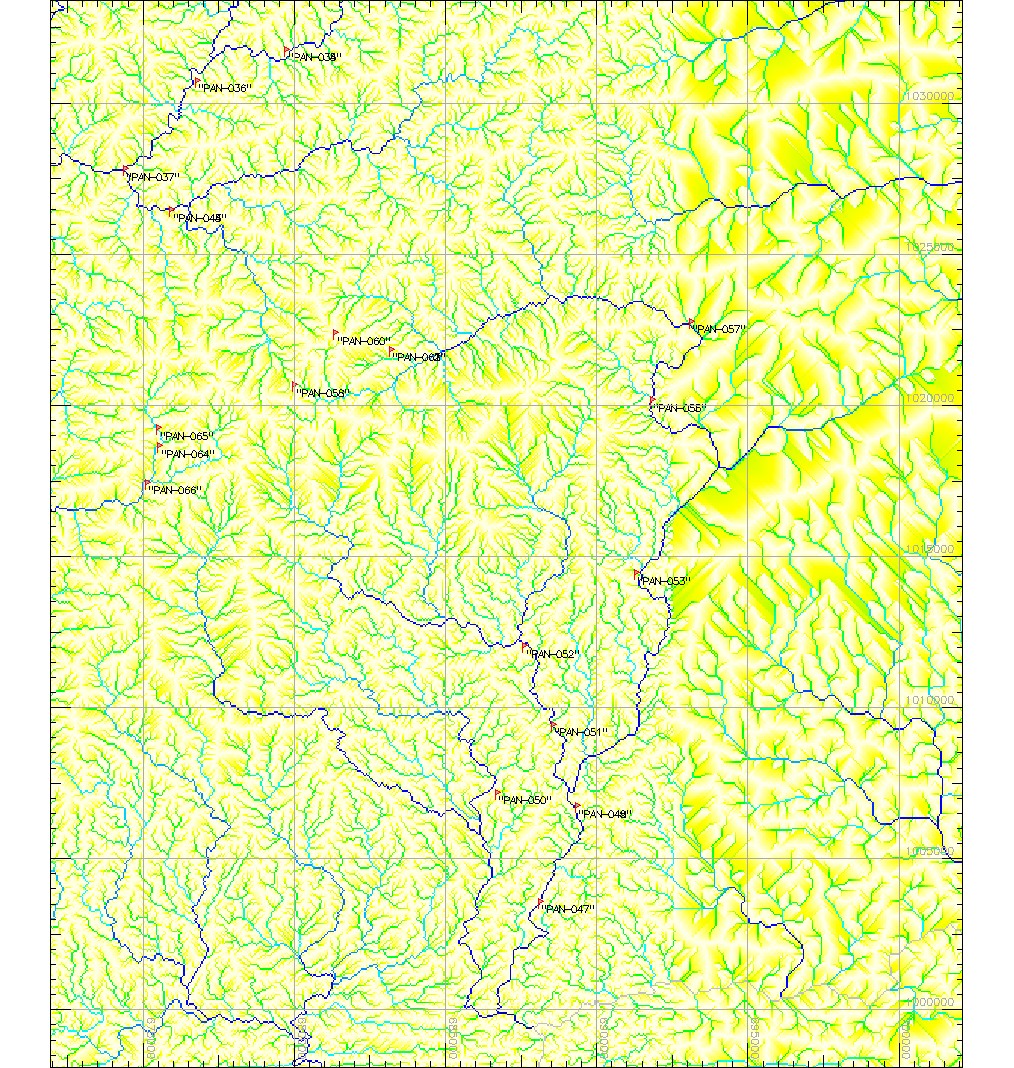
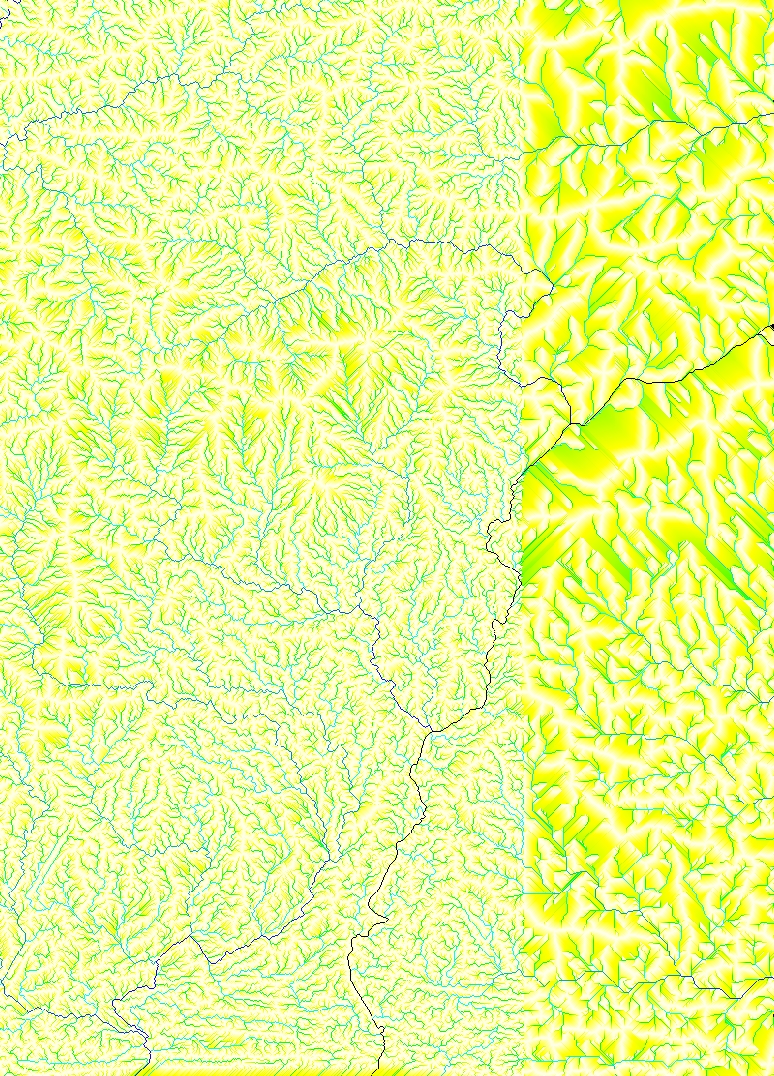
Flowaccumulation and sites for Pacora basin
Chagres and northern basins and streams
Pequeni basin and stream network
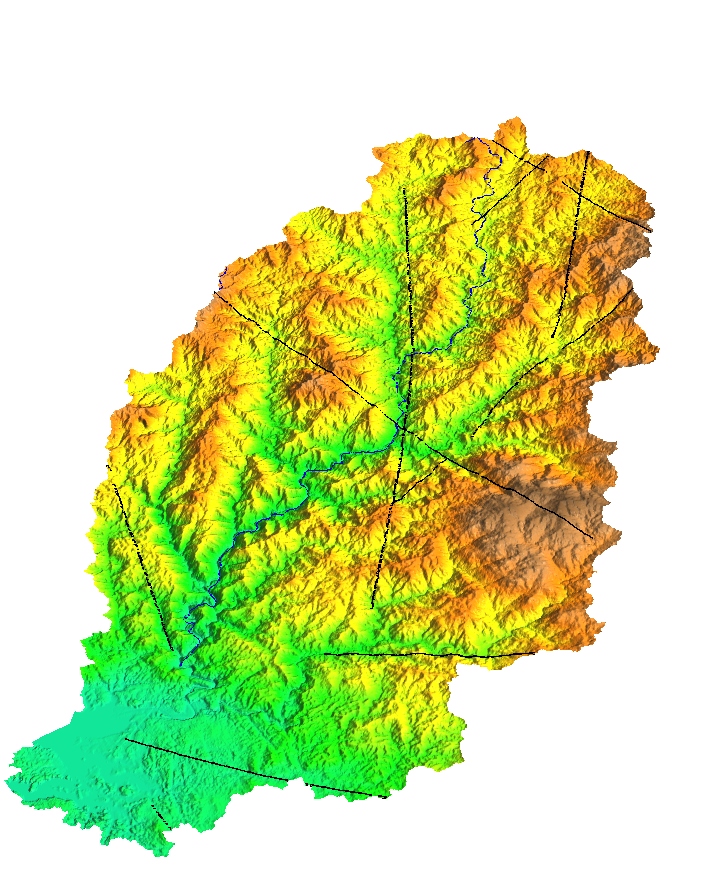
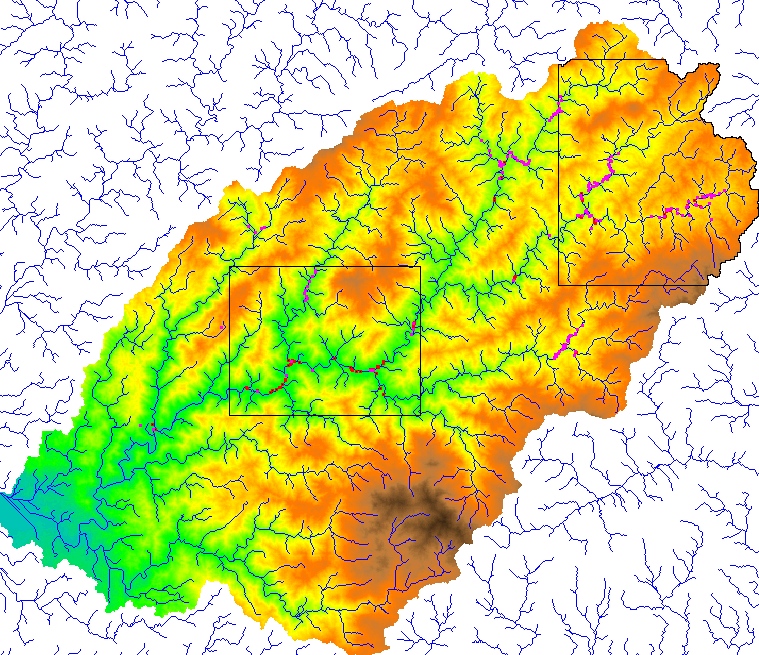
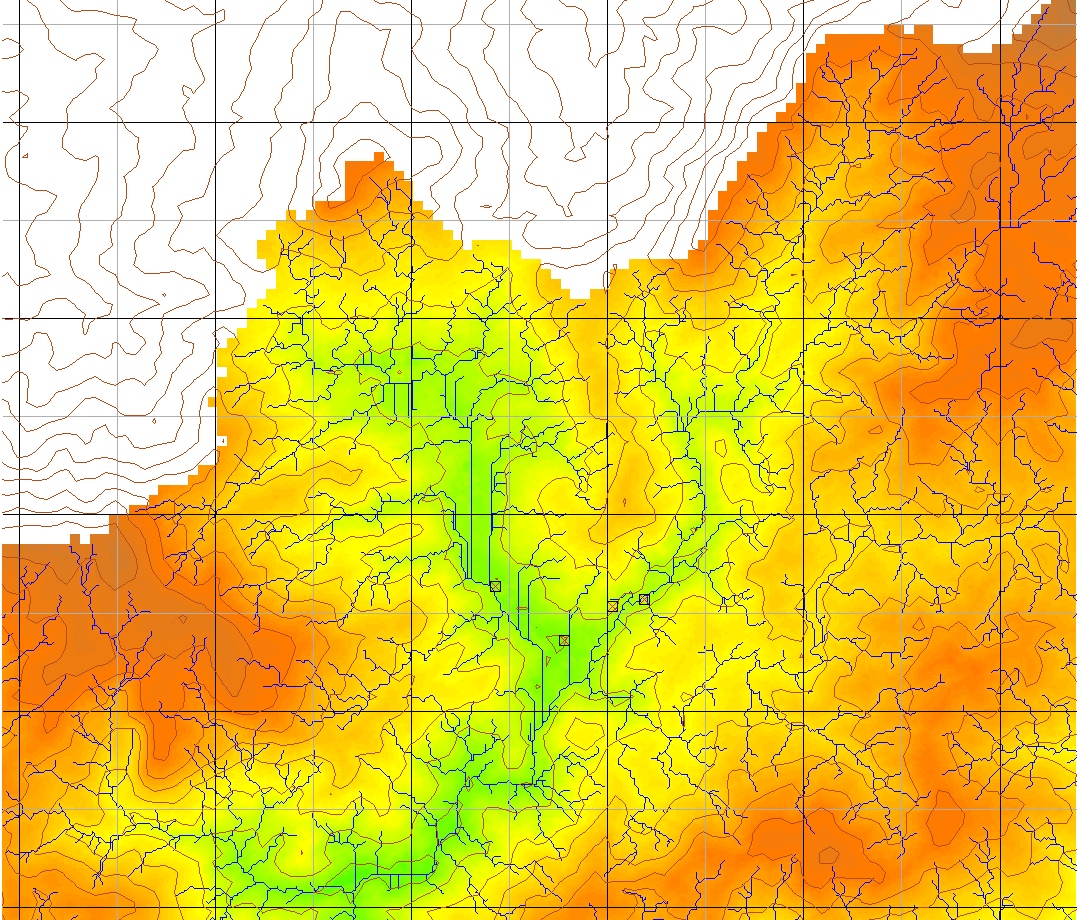
Pacora flow accumulation at 30m res draped on terrain
Pacora flow accumulation at 30m res (2D)
(note that 50m res. result fixes the confluence with T river)
Images based on 25m and 50m resolution analysis
Comparison of stream extraction tools
High resolution (10m) images for February 2003 study areas
go to
http://skagit.meas.ncsu.edu/~helena/measwork/panama/
and download map*.jpg images
Lower left (SW) coordinates for the UTM grid for each image are here:
grey : 500m grid, black: 1000m grid

A Upper Chagrito
683900,1035500

B Chamor
681400,1025300

C Vistamares
673800,1020200

D Esperanza-Chagres confluence
674200,1029700

E Upper Chico
666000,1032700

F Lower Chagres
659900,1020200
Draft presentation
Overview of layers available at NCSU
Download:
Vector data layers in a zip file shape files for geology, land cover, stream network
Coordinates of the field sites on the streams: plain text file field sites
Original 10m resolution IFSARE-based DEM, basin/sub-basins and stream networks:
Information about these layers
DEM (47MB)||
Basin 50m||
Basin 25m||
Stream directions 50m||
Stream directions 25m||
Stream directions 10m||
Filled 10m resolution IFSARE-based DEM, basin/sub-basins and stream networks:
(do not use, this is just for comparison of algorithms)
DEM (46MB)||
Basin 50m||
Basin 25m||
Stream directions 50m||
Stream directions 25m||
Selected statistics about the watershed
Basin size = 576.90 sq km or 120,000 ha
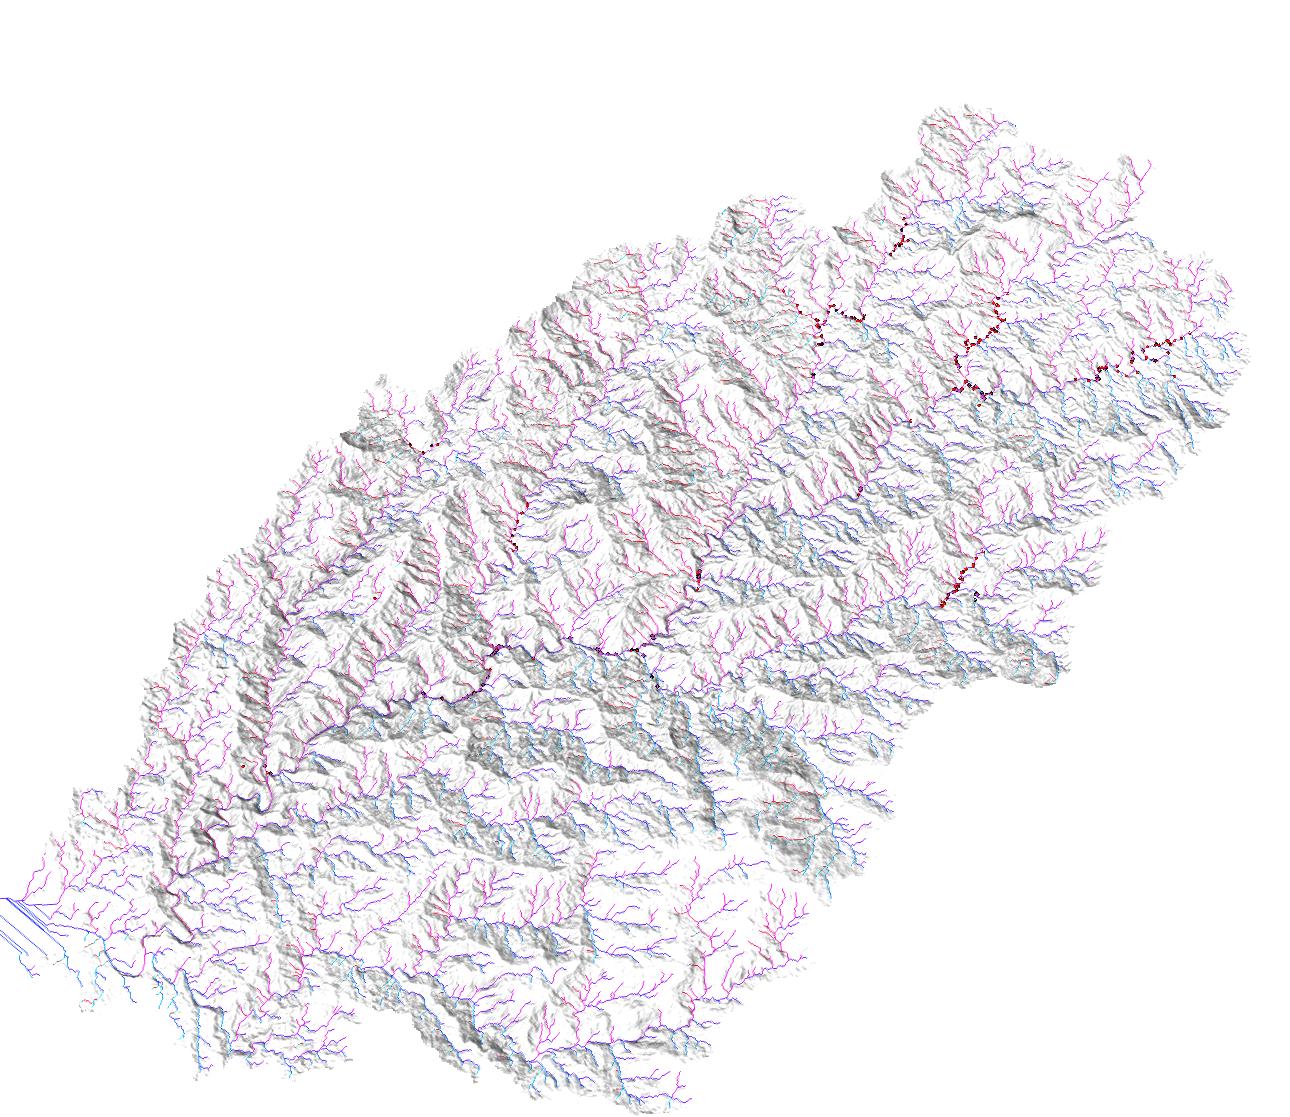
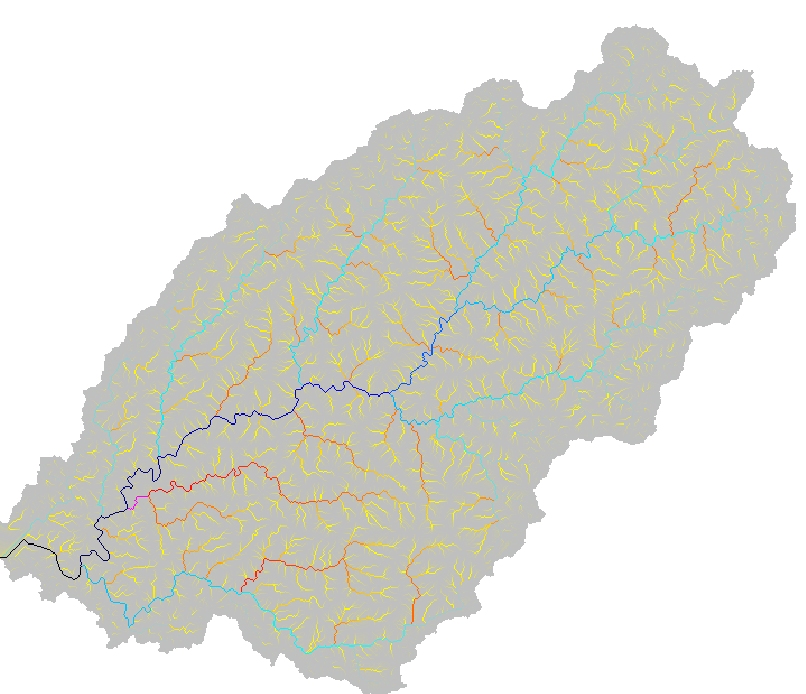
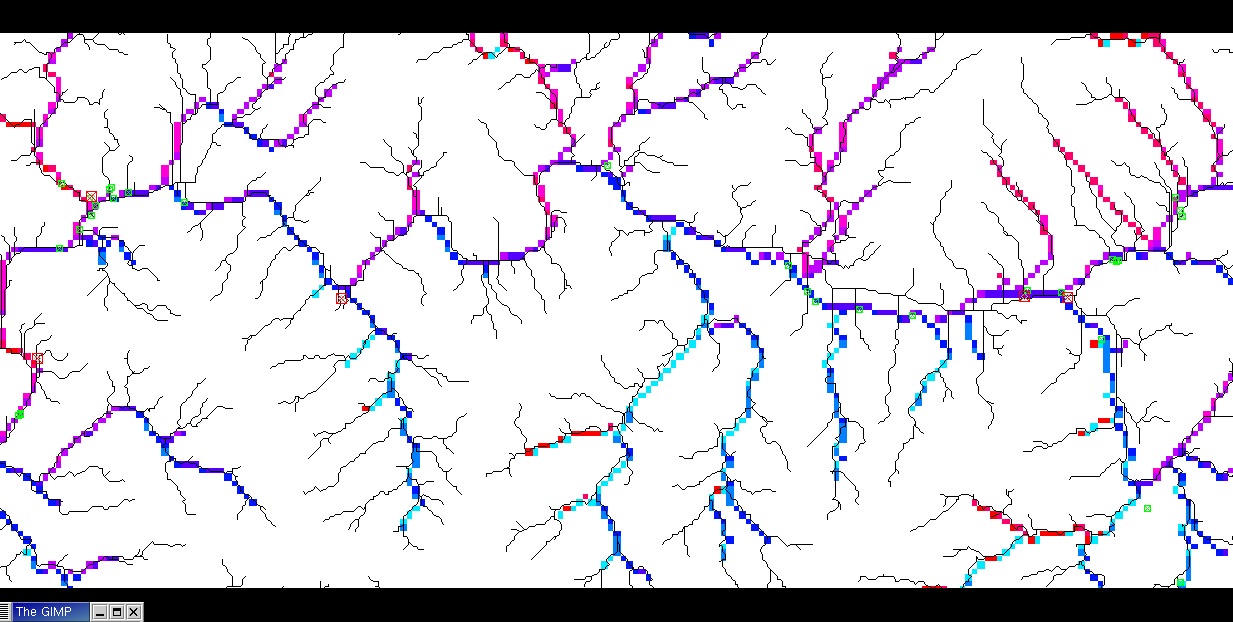
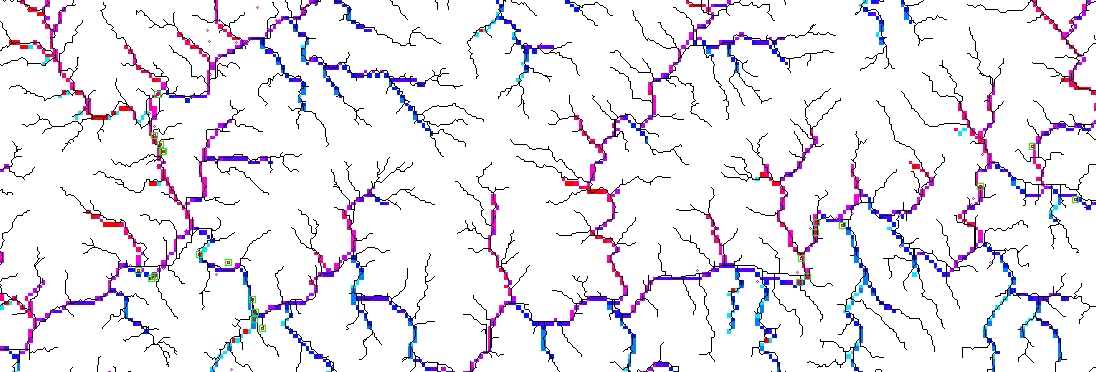
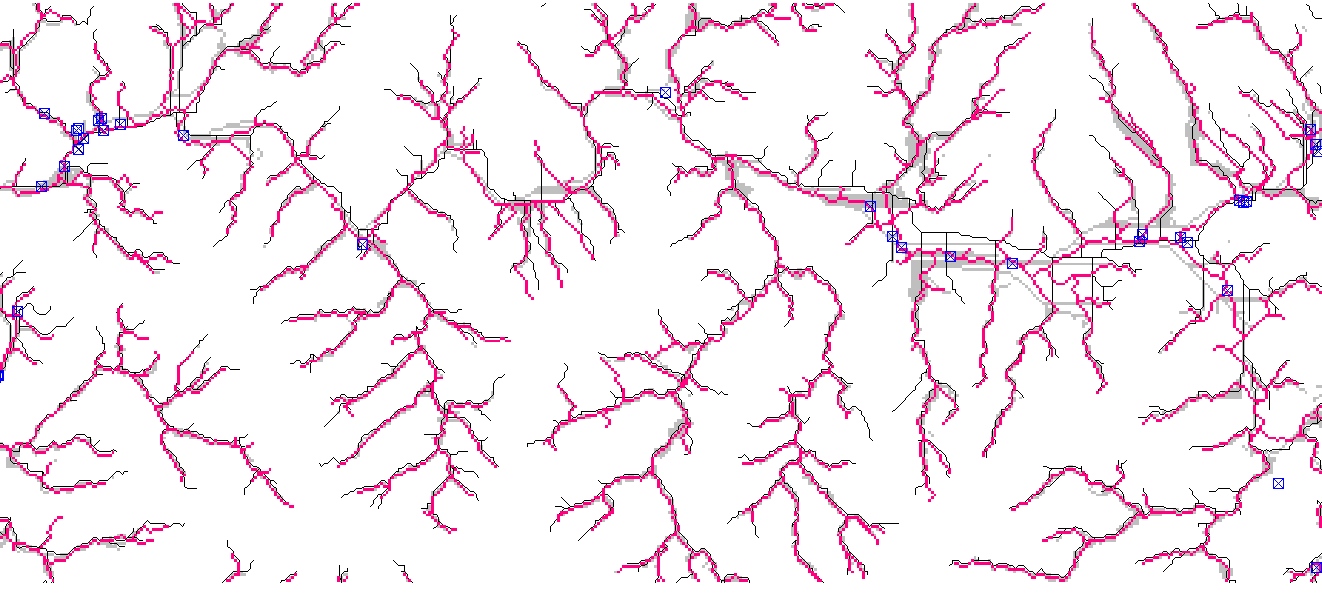
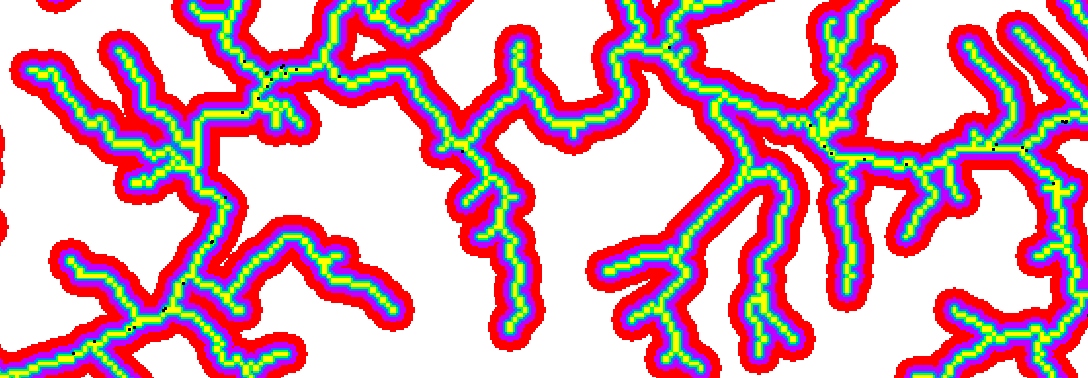
Multiscale analysis of stream network direction
Stream network and its direction extracted from IFSARE DEM using r.watershed in GRASS5.0 at different resolutions (click on the images to see them full size, 25 and 50m resolution needs bigger picture to preserve the resolution):
related histograms and reports: new results
 50m DEM
 Basin=576.90 sq km
|MAP: dirstr.50*bas.mask50 (dirstr.50mask in helena)                          |
|-----------------------------------------------------------------------------|
|                   Category Information                    |  square  |   %  |
| #|description                                             |kilometers| cover|
|-----------------------------------------------------------------------------|
|-4| . . . . . . . . . . . . . . . . . . . . . . . . . . . .|  0.002497|  0.00|
| 0| . . . . . . . . . . . . . . . . . . . . . . . . . . . .| 35.376531| 51.83|
| 1| NE. . . . . . . . . . . . . . . . . . . . . . . . . . .|  1.595652|  2.34|
| 2| N . . . . . . . . . . . . . . . . . . . . . . . . . . .|  3.056460|  4.48|
| 3| NW. . . . . . . . . . . . . . . . . . . . . . . . . . .|  5.503626|  8.06|
| 4| W . . . . . . . . . . . . . . . . . . . . . . . . . . .|  6.355140|  9.31|
| 5| SW. . . . . . . . . . . . . . . . . . . . . . . . . . .|  6.684759|  9.79|
| 6| S . . . . . . . . . . . . . . . . . . . . . . . . . . .|  4.866864|  7.13|
| 7| SE. . . . . . . . . . . . . . . . . . . . . . . . . . .|  3.348622|  4.91|
| 8| E . . . . . . . . . . . . . . . . . . . . . . . . . . .|  1.465802|  2.15|
|-----------------------------------------------------------------------------|
|TOTAL  cells=480525                                        | 68.255955|100.00|
+-----------------------------------------------------------------------------+
related histograms and reports (old results)
25m 56762cells                                              area [sqkm] %area
| 1|NE . . . . . . . . . . . . . . . . . . . . . . . . . . .|  2.732517|  7.70|
| 2|E. . . . . . . . . . . . . . . . . . . . . . . . . . . .|  3.405021|  9.60|
| 3|SE . . . . . . . . . . . . . . . . . . . . . . . . . . .|  6.425039| 18.11|
| 4|S. . . . . . . . . . . . . . . . . . . . . . . . . . . .|  5.614409| 15.83|
| 5|SW . . . . . . . . . . . . . . . . . . . . . . . . . . .|  6.543790| 18.45|
| 6|W. . . . . . . . . . . . . . . . . . . . . . . . . . . .|  4.402527| 12.41|
| 7|NW . . . . . . . . . . . . . . . . . . . . . . . . . . .|  4.166275| 11.74|
| 8|N. . . . . . . . . . . . . . . . . . . . . . . . . . . .|  2.179388|  6.14|
|-----------------------------------------------------------------------------|
|TOTAL                                                      | 35.476467|100.00|

50m 14542cells
| 1| . . . . . . . . . . . . . . . . . . . . . . . . . . . .|  1.791434|  4.92|
| 2| . . . . . . . . . . . . . . . . . . . . . . . . . . . .|  3.452764|  9.49|
| 3| . . . . . . . . . . . . . . . . . . . . . . . . . . . .|  6.450163| 17.73|
| 4| . . . . . . . . . . . . . . . . . . . . . . . . . . . .|  6.958069| 19.12|
| 5| . . . . . . . . . . . . . . . . . . . . . . . . . . . .|  7.631108| 20.97|
| 6| . . . . . . . . . . . . . . . . . . . . . . . . . . . .|  5.024021| 13.81|
| 7| . . . . . . . . . . . . . . . . . . . . . . . . . . . .|  3.507808|  9.64|
| 8| . . . . . . . . . . . . . . . . . . . . . . . . . . . .|  1.566254|  4.30|
|-----------------------------------------------------------------------------|
|TOTAL                                                      | 36.384121|100.00|

100m 3715cells
| 1| . . . . . . . . . . . . . . . . . . . . . . . . . . . .|  0.779386|  2.10|
| 2| . . . . . . . . . . . . . . . . . . . . . . . . . . . .|  2.937685|  7.91|
| 3| . . . . . . . . . . . . . . . . . . . . . . . . . . . .|  6.285046| 16.93|
| 4| . . . . . . . . . . . . . . . . . . . . . . . . . . . .|  8.083629| 21.78|
| 5| . . . . . . . . . . . . . . . . . . . . . . . . . . . .|  9.702353| 26.14|
| 6| . . . . . . . . . . . . . . . . . . . . . . . . . . . .|  5.725487| 15.42|
| 7| . . . . . . . . . . . . . . . . . . . . . . . . . . . .|  2.847755|  7.67|
| 8| . . . . . . . . . . . . . . . . . . . . . . . . . . . .|  0.749409|  2.02|
|-----------------------------------------------------------------------------|
|TOTAL                                                      | 37.120743|100.00|

200m 988cells
| 1| . . . . . . . . . . . . . . . . . . . . . . . . . . . .|  0.199965|  0.51|
| 2| . . . . . . . . . . . . . . . . . . . . . . . . . . . .|  1.799684|  4.55|
| 3| . . . . . . . . . . . . . . . . . . . . . . . . . . . .|  6.638834| 16.80|
| 4| . . . . . . . . . . . . . . . . . . . . . . . . . . . .|  9.878265| 25.00|
| 5| . . . . . . . . . . . . . . . . . . . . . . . . . . . .| 13.037710| 33.00|
| 6| . . . . . . . . . . . . . . . . . . . . . . . . . . . .|  6.038939| 15.28|
| 7| . . . . . . . . . . . . . . . . . . . . . . . . . . . .|  1.799684|  4.55|
| 8| . . . . . . . . . . . . . . . . . . . . . . . . . . . .|  0.079986|  0.20|
|-----------------------------------------------------------------------------|
|TOTAL                                                      | 39.513061|100.00|
+-----------------------------------------------------------------------------+

300m 434cells
| 1| . . . . . . . . . . . . . . . . . . . . . . . . . . . .|  0.089699|  0.23|
| 2| . . . . . . . . . . . . . . . . . . . . . . . . . . . .|  1.435177|  3.69|
| 3| . . . . . . . . . . . . . . . . . . . . . . . . . . . .|  6.727390| 17.28|
| 4| . . . . . . . . . . . . . . . . . . . . . . . . . . . .|  9.328647| 23.96|
| 5| . . . . . . . . . . . . . . . . . . . . . . . . . . . .| 13.723876| 35.25|
| 6| . . . . . . . . . . . . . . . . . . . . . . . . . . . .|  6.278897| 16.13|
| 7| . . . . . . . . . . . . . . . . . . . . . . . . . . . .|  0.986684|  2.53|
|-----------------------------------------------------------------------------|
|TOTAL                                                      | 38.929163|100.00|
+-----------------------------------------------------------------------------+

400m 250cells
| 2| . . . . . . . . . . . . . . . . . . . . . . . . . . . .|  0.479336|  1.20|
| 3| . . . . . . . . . . . . . . . . . . . . . . . . . . . .|  7.349825| 18.40|
| 4| . . . . . . . . . . . . . . . . . . . . . . . . . . . .|  9.746507| 24.40|
| 5| . . . . . . . . . . . . . . . . . . . . . . . . . . . .| 14.859429| 37.20|
| 6| . . . . . . . . . . . . . . . . . . . . . . . . . . . .|  6.231373| 15.60|
| 7| . . . . . . . . . . . . . . . . . . . . . . . . . . . .|  0.798894|  2.00|
|-----------------------------------------------------------------------------|
|TOTAL                                                      | 39.944701|100.00|
+-----------------------------------------------------------------------------+

500m 150cells
| 3| . . . . . . . . . . . . . . . . . . . . . . . . . . . .|  7.724040| 20.67|
| 4| . . . . . . . . . . . . . . . . . . . . . . . . . . . .|  8.471528| 22.67|
| 5| . . . . . . . . . . . . . . . . . . . . . . . . . . . .| 14.202268| 38.00|
| 6| . . . . . . . . . . . . . . . . . . . . . . . . . . . .|  4.484927| 12.00|
| 7| . . . . . . . . . . . . . . . . . . . . . . . . . . . .|  1.993301|  5.33|
|-----------------------------------------------------------------------------|
|TOTAL                                                      | 37.374389|100.00|
+-----------------------------------------------------------------------------+
This project is supported by Army Research Office and National Research Council
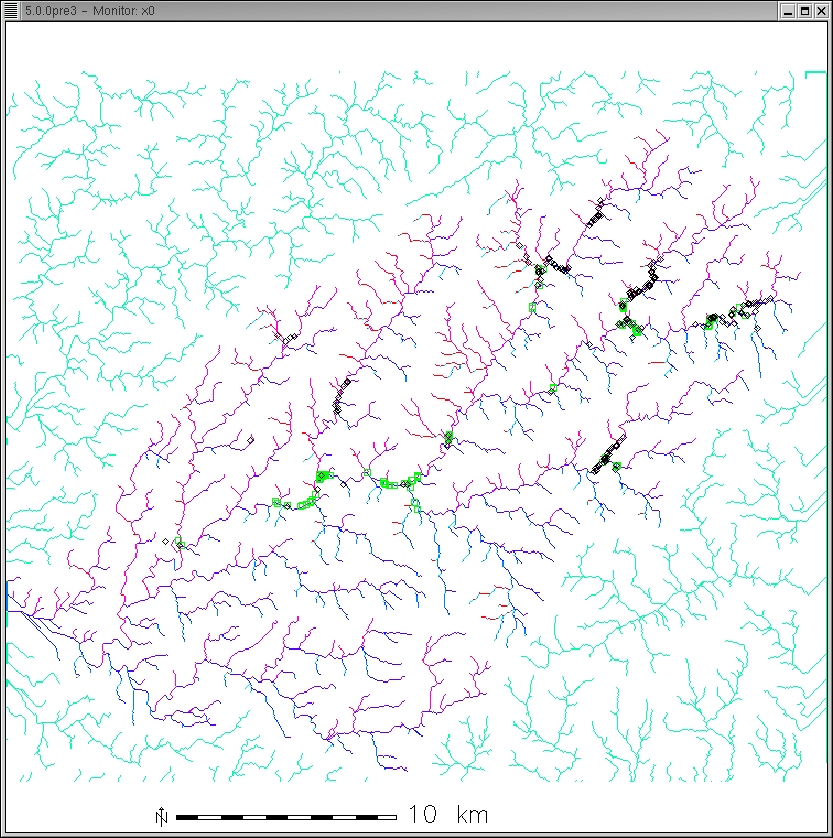
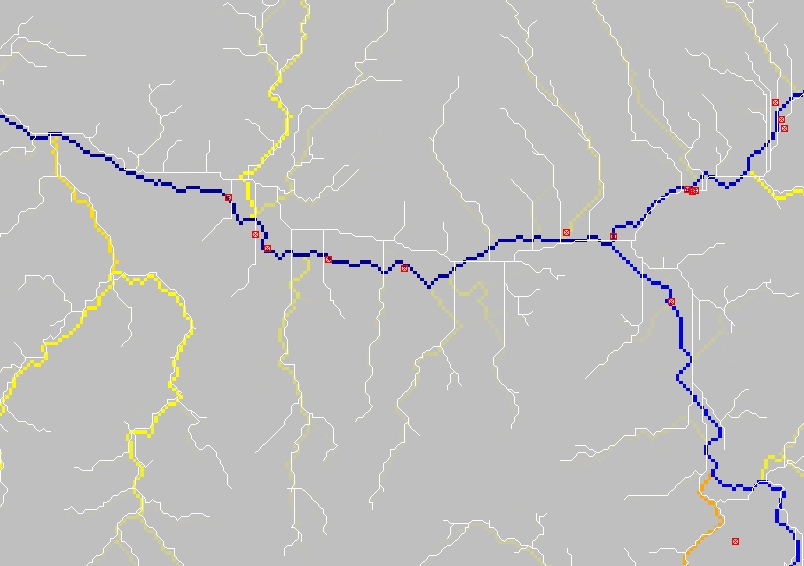
 DEM, streams, field sites
![[IMG]](dirstreams25m.jpg) 25m
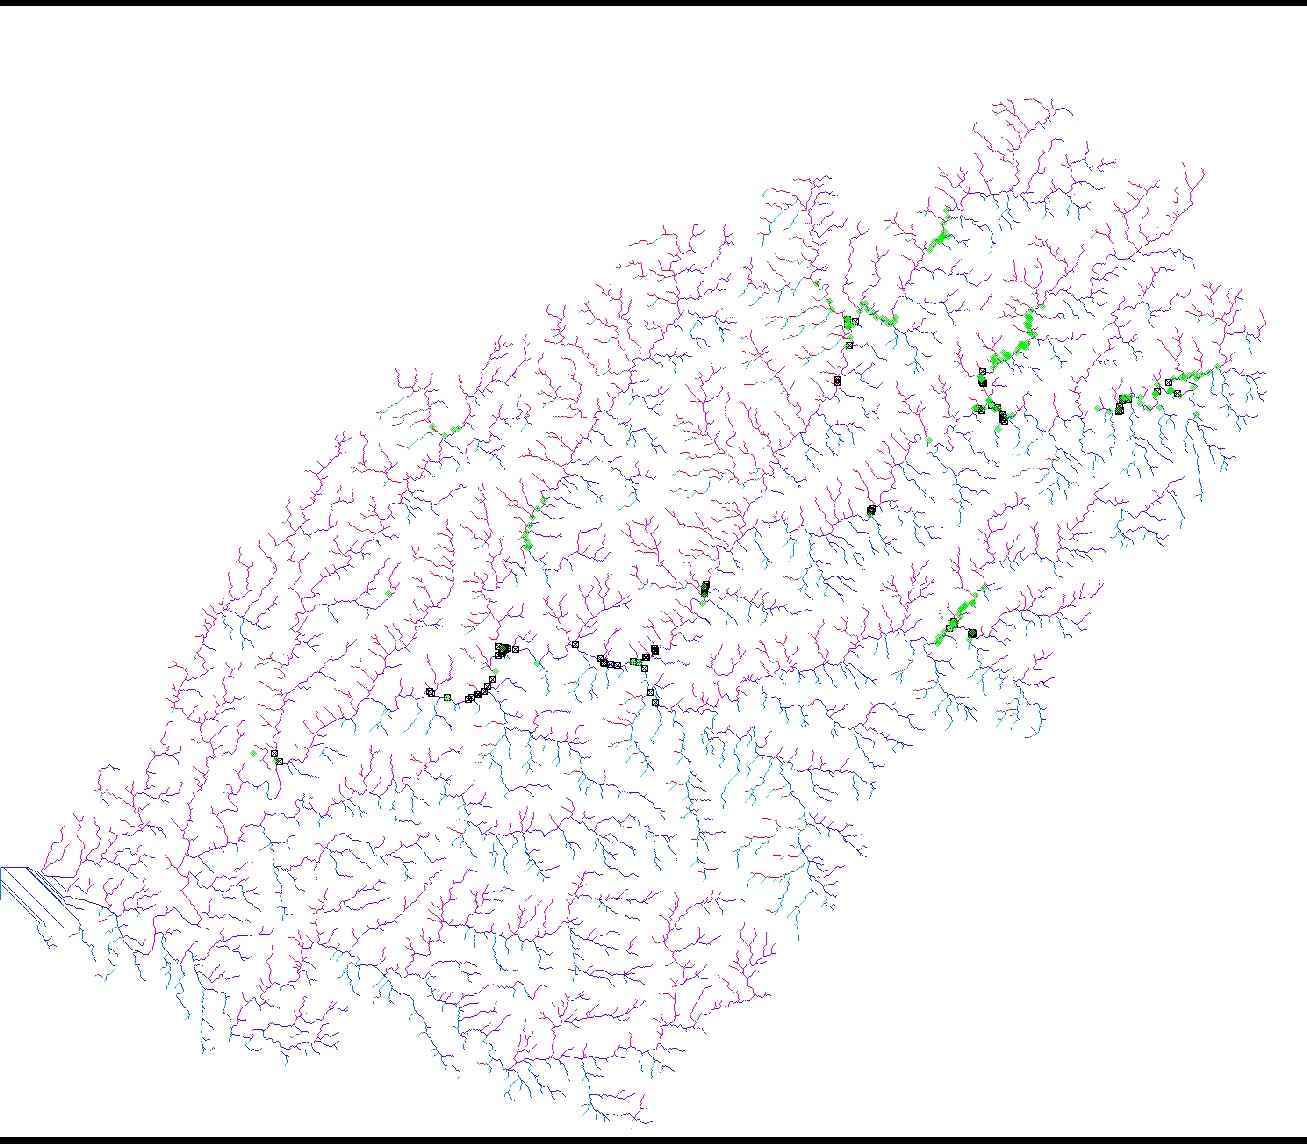
25m![[IMG]](panamstr50m.jpg) 50m
50m![[IMG]](dirstreams100m.jpg) 100m
100m![[IMG]](dirstreams200m.jpg) 200m
200m![[IMG]](dirstreams300m.jpg) 300m
300m![[IMG]](dirstreams400m.jpg) 400m
400m![[IMG]](dirstreams500m.jpg) 500m
500m![[IMG]](legdirstream.jpg) legend
legend