 GeoIS-EM Home
Mound sidescan sonar data processing, analysis and visualization
GeoIS-EM Home
Mound sidescan sonar data processing, analysis and visualization
GeoIS-EM Home
Mound sidescan sonar data processing, analysis and visualization
GIS data processing is performed for the USACE project: Monitoring Processes and the Fate of a Mixed-Sediment Mound at the Cape Fear River, NC
Summary statistics for the surfaces and their differences presented below. Size of the study area is 300 x 250 m
Notes: the visible rectangles show area with insufficient data coverage - the elevation differences between segments indicate the level of uncertainty.
a) RST interpolated surface from January 2002 (minimal smoothing, resolution 0.5m)
Difference draped over Apr. 01 surface: yellow-red is loss, cyan-blue is gain.
Mean loss was 0.23m while mean gain was 0.24m.
The maximum height of the mound was reduced only from -6.4 to -6.7m (around 0.3m),
based on the given data, or -6.6 to -7.2 (around 0.6m) based on the smoothed surfaces.
The difference between "raw" surfaces is <-1.7, +1.7m>, with net volume difference
8380 cubic m gain mostly on NE side of the mound.
The difference between smoothed surfaces is <-1.1, +0.8> with net volume difference
8540 cubic m.
Slope was reduced from <0.,9.> degrees to <0.,6.> degrees.
![[IMG]](brunswick2d.jpg) a)
a)![[IMG]](moundbhleg10m.jpg) b)
b)![[IMG]](larclidsonlg.jpg) c)
c)![[IMG]](bhlarclid00.jpg) c)
c)![[IMG]](mnapr01sit.jpg) a)
a)![[IMG]](mnapr01.jpg) b)
b) ![[IMG]](moundt300s6cont.jpg) c)
c)![[IMG]](moundt300s6def.jpg) d)
d)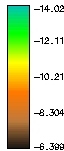 legend
![[IMG]](mnjan02.jpg) a)
a)![[IMG]](mnaprjan.jpg) a
a![[IMG]](mn0102cutc.jpg) b
b![[IMG]](mn0102cutd.jpg) b
b![[IMG]](mn0102cute.jpg) b
b![[IMG]](mn0102difa.jpg) a
a![[IMG]](mn0102difb.jpg) b
b![[IMG]](mndifN.jpg) c
c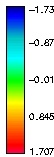 legend