 GeoIS-EM Home
Mound sidescan sonar data processing, analysis and visualization
GeoIS-EM Home
Mound sidescan sonar data processing, analysis and visualization
GeoIS-EM Home
Mound sidescan sonar data processing, analysis and visualization
GIS data processing is performed for the USACE project:
Monitoring Processes and the Fate of a Mixed-Sediment Mound at the Cape Fear River, NC
Mnoitoring data sets
a) Bathymetry survey pattern
b) Bathymetry in April 2001 and January 2002
c) Slope in April 2001 and January 2002
![[bathymetry]](mnjanbigorig.jpg) a
a
![[bathymetry]](elbigaprjan.jpg) b
b
![[slope]](slopebig.jpg) b
b
bathymetry: view from the NE (shore)
a) April 2001, b) January 2002
![[IMG]](mnaprbig.jpg) a)
a)
![[IMG]](mnjanbig.jpg) b)
b)
Orientation image for most of the views used in the analysis:
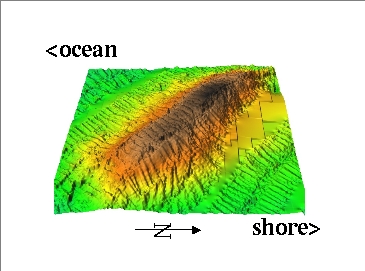
Summary statistics for the surfaces and their differences presented below. Size of the study area is 300 x 250 m
Note: the visible rectangles show area with insufficient data coverage - the elevation differences between segments indicate the level of uncertainty.
a) RST interpolated surface from January 2002 (minimal smoothing, resolution 0.5m)
b) interpolated and smoothed by RST
c) overlayed RST surfaces with and without smoothing.
Difference draped over Apr. 01 surface: yellow-red is loss, cyan-blue is gain.
Mean loss was 0.23m while mean gain was 0.24m.
The maximum height of the mound was reduced only from -6.4 to -6.7m (around 0.3m),
based on the given data, or -6.6 to -7.2 (around 0.6m) based on the smoothed surfaces.
The difference between "raw" surfaces is <-1.7, +1.7m>, with net volume difference
8380 cubic m gain mostly on NE side of the mound.
The difference between smoothed surfaces is <-1.1, +0.8> with net volume difference
8540 cubic m.
Slope was reduced from <0.,9.> degrees to <0.,6.> degrees.
This project is supported by Army Research Office and National Research Council
![[IMG]](brunswick2d.jpg) a)
a)![[IMG]](larclidsonlg.jpg) b)
b)![[IMG]](bhlarclid00.jpg) c)
c)![[IMG]](bhlarclid00mn3d.jpg) a)
a)![[IMG]](bhlarclid00mn3ds.jpg) b)
b)![[IMG]](bhlarclid00mn3dz.jpg) c)
c)![[IMG]](mnapr01sit.jpg) a)
a)![[IMG]](mnapr01.jpg) b)
b) ![[IMG]](moundt300s6cont.jpg) c)
c)![[IMG]](moundt300s6def.jpg) d)
d)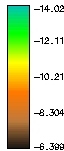 legend
![[IMG]](mnjan02.jpg) a)
a)![[IMG]](mnjansmoth.jpg) b)
b)![[IMG]](mnjoandefsmo.jpg) c)
c)![[IMG]](mnaprjan.jpg) a
a![[IMG]](mn0102cutc.jpg) b
b![[IMG]](mn0102cutd.jpg) b
b![[IMG]](mn0102cute.jpg) b
b![[IMG]](mncutsm1.jpg) b
b![[IMG]](mncutsm2.jpg) b
b![[IMG]](mn0102difa.jpg) a
a![[IMG]](mn0102difb.jpg) b
b![[IMG]](difft300cont.jpg) c
c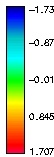 legend