 Figure 1 Location of JR
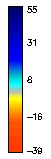
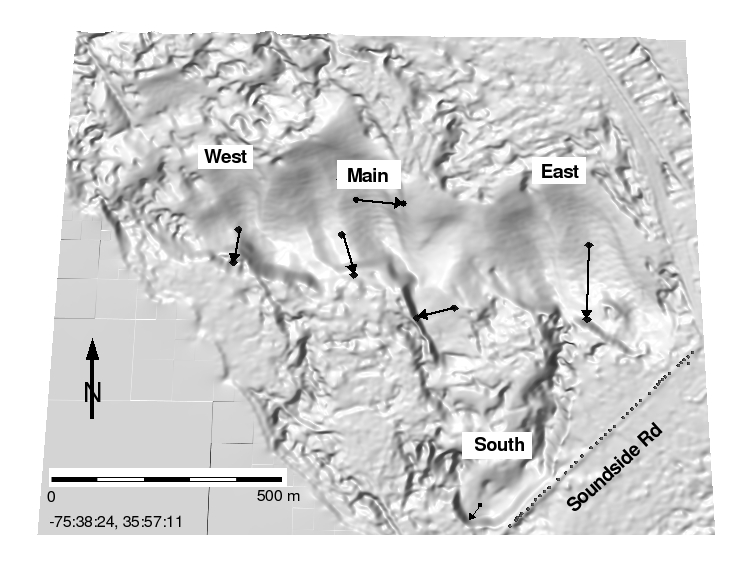 Figure 2 Dune sections, road test points, profiles
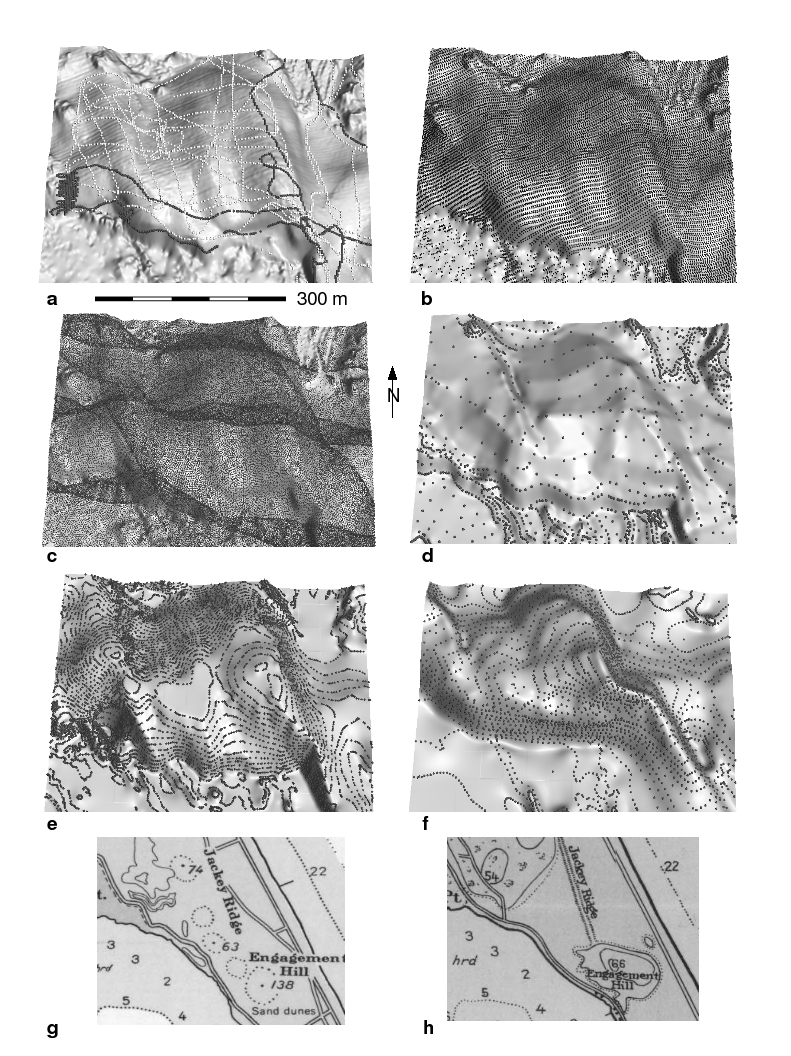 Figure 3 Elevation data 1915-2004
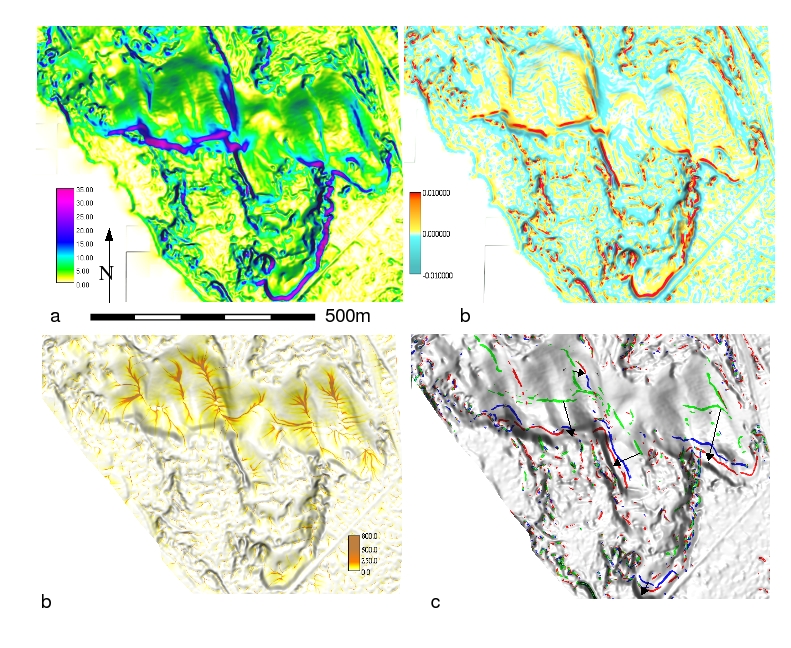 Figure 4 Topographic parameters
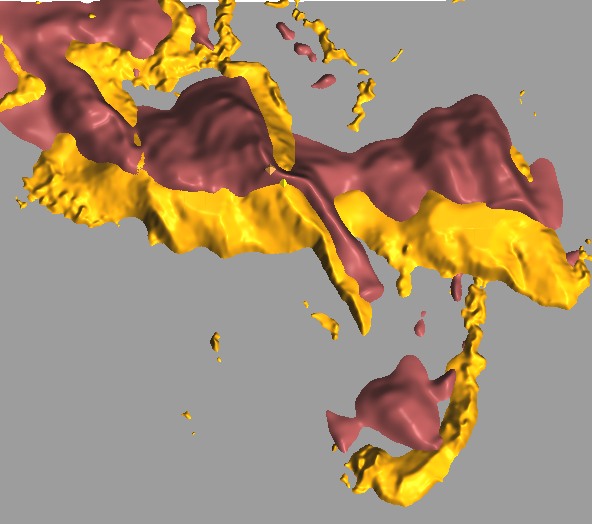
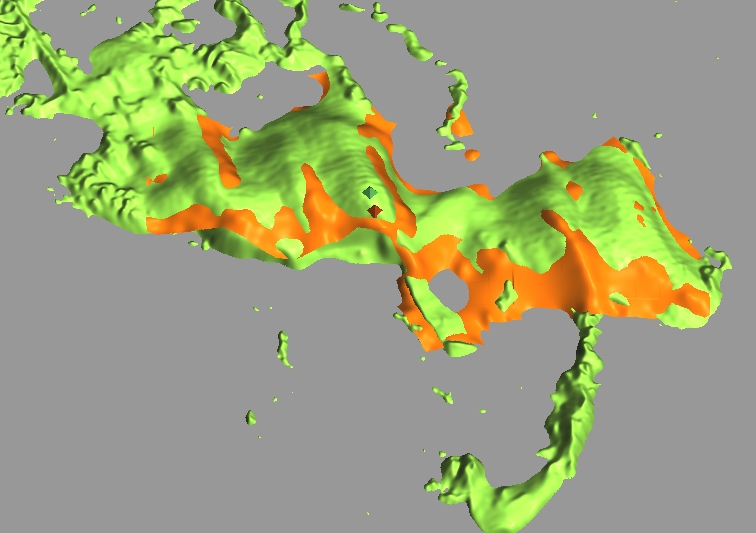
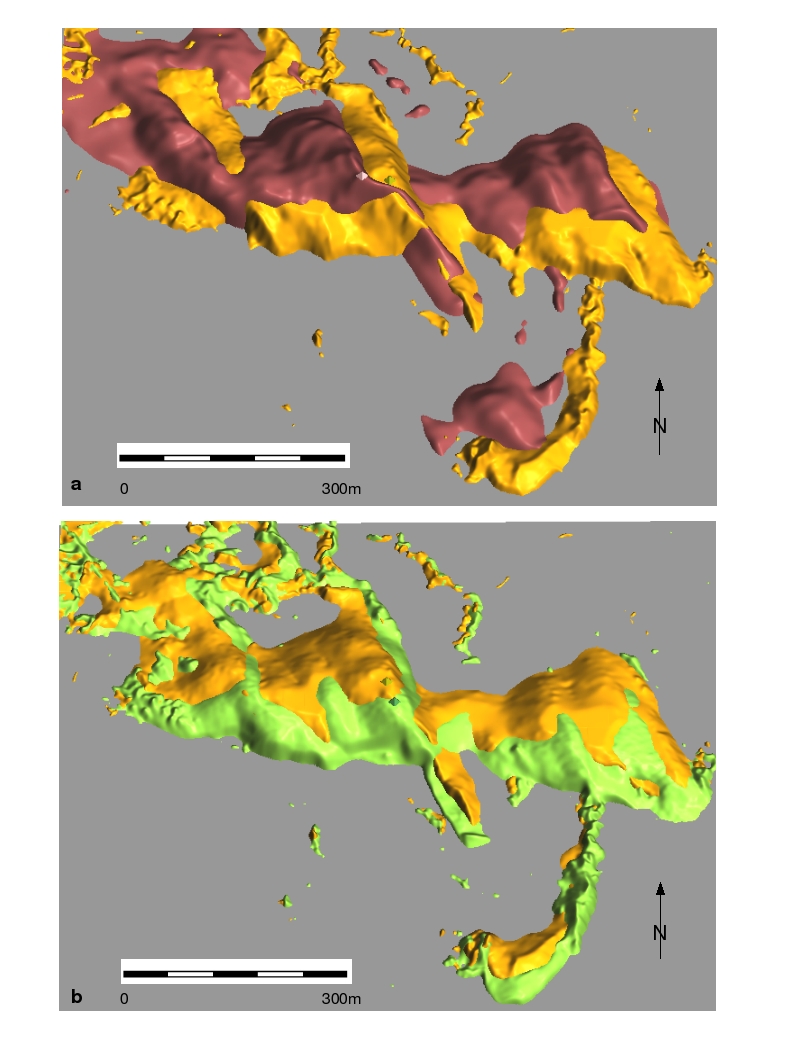 Figure 6 Overlay of elevation surfaces
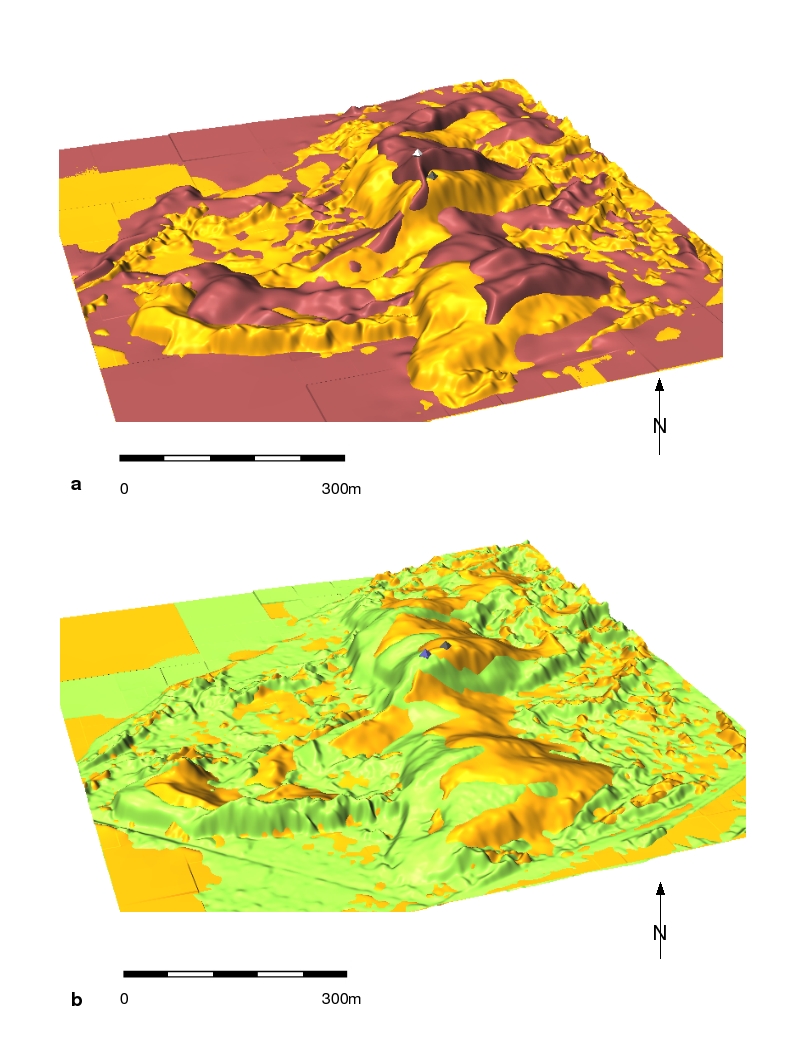 Figure 6 different version
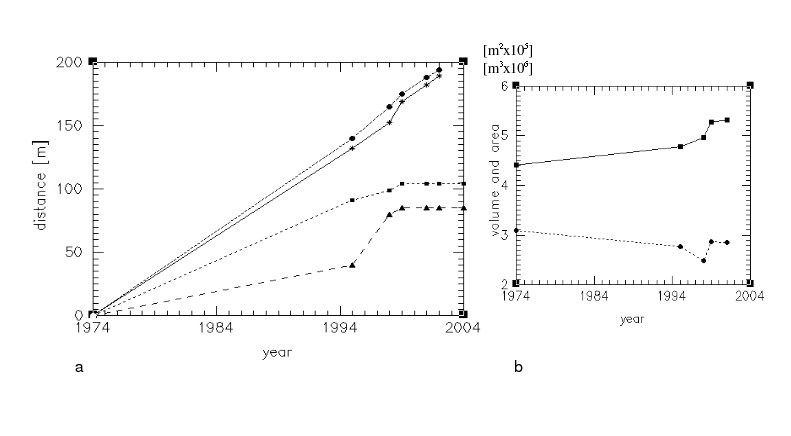 Figure 7. Horizontal migration and volume change
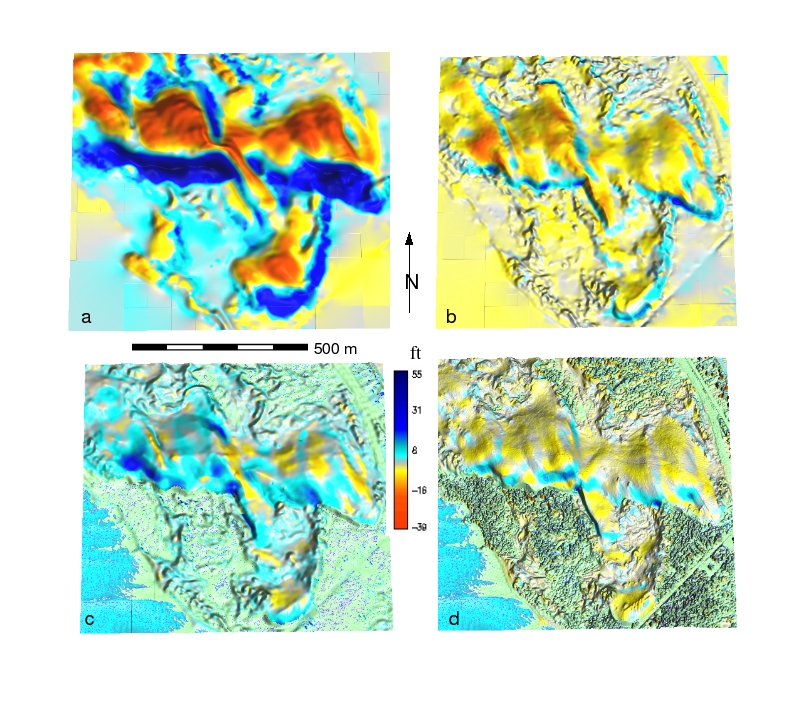 Figure 8. Elevation differences
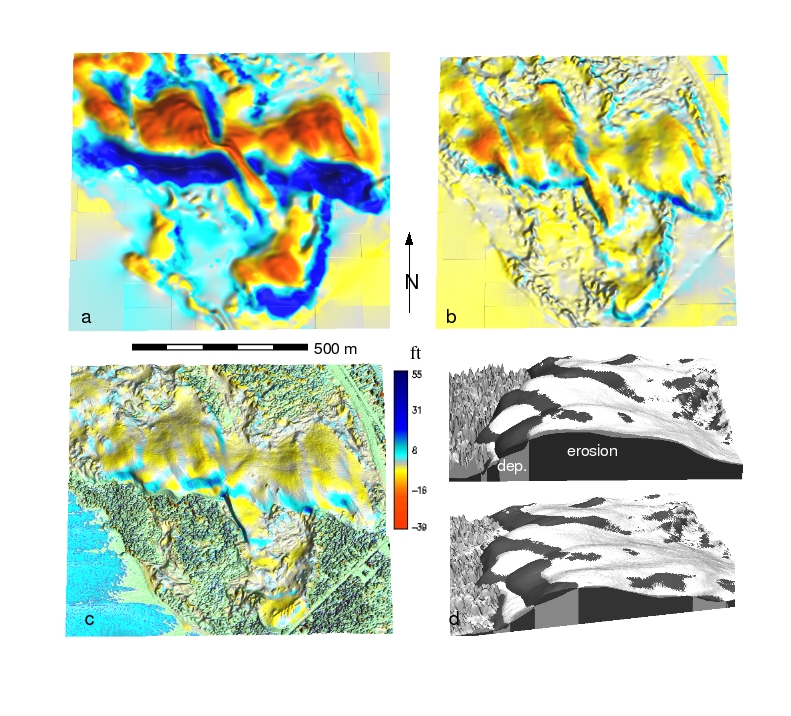 Figure 8. differennt version
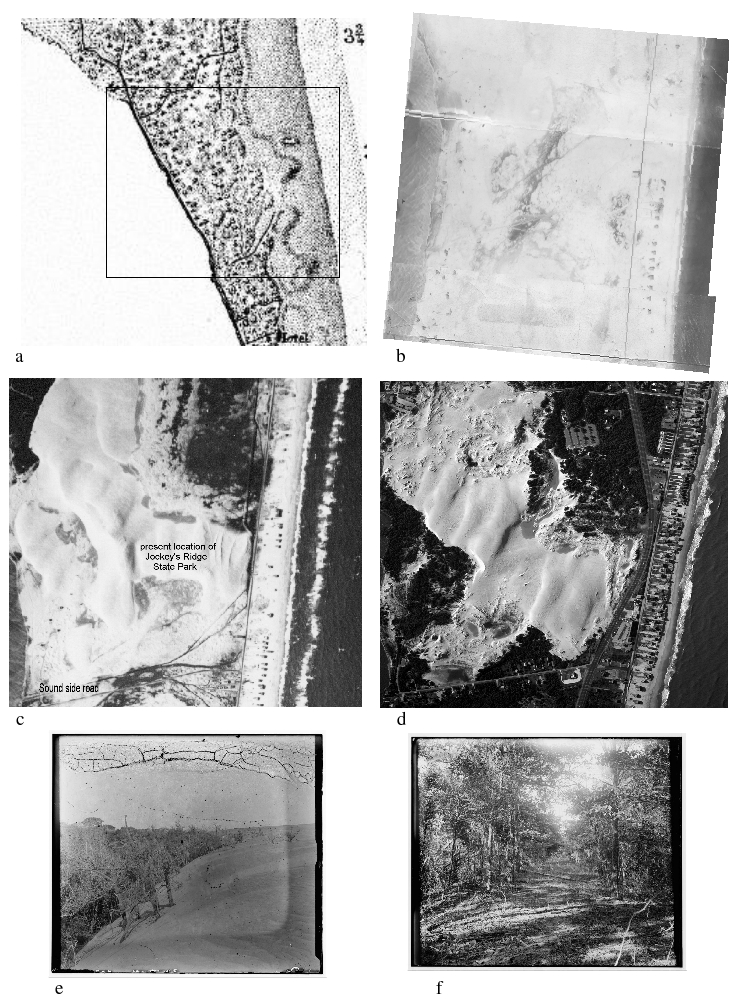 Figure 9 Evolution of land cover
separate images and additional pictures
 1974-1995
 1995 and 2001
overlays for each time interval- only dunes >6m are displayed
 1999-2001
 2001-2004(limited data)
The slip face on the lower souther arm of the main dune flipped from east to west 1974-1995
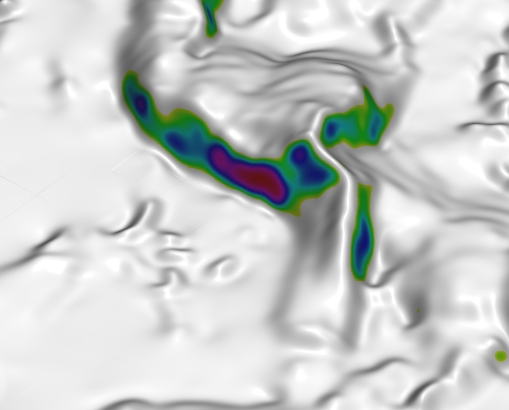
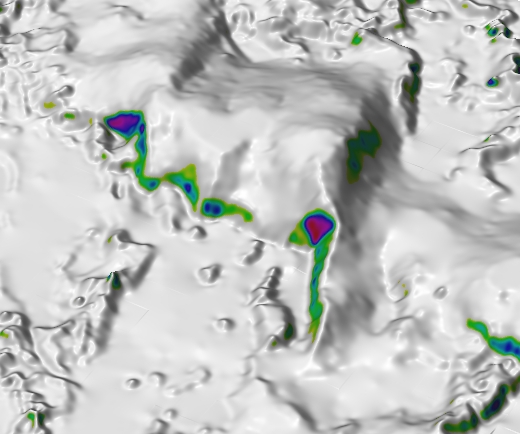
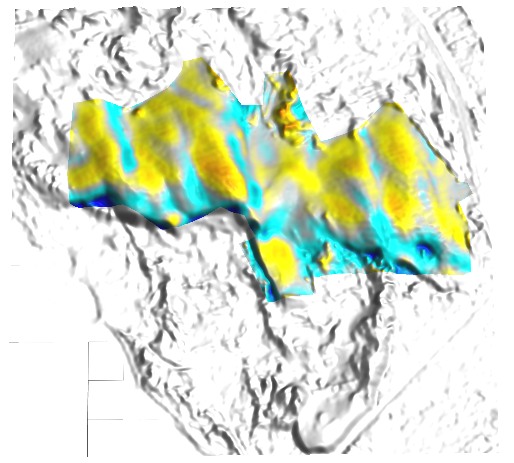
Individual images: DEMs with change draped over the surface (blue is deposition, red-yellow is erosion,
see the legend below)
 1974-95
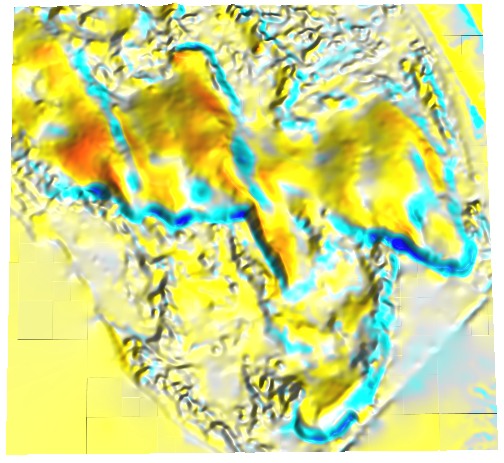 1995-98
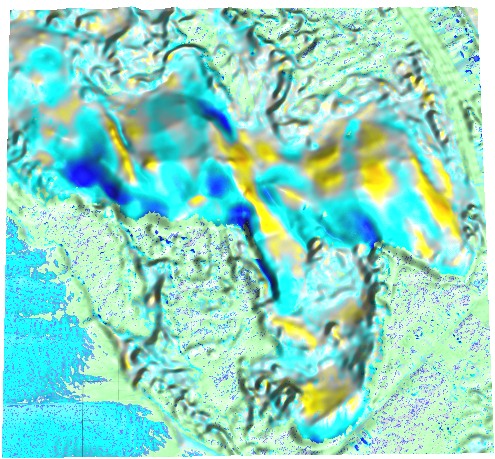 1998-99
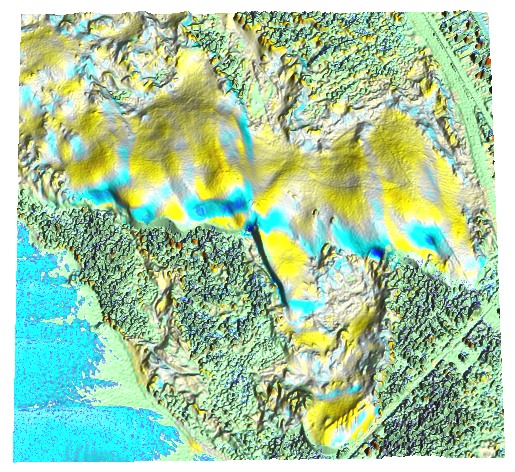 1999-01
 2001-04
Additional Historical and current photos
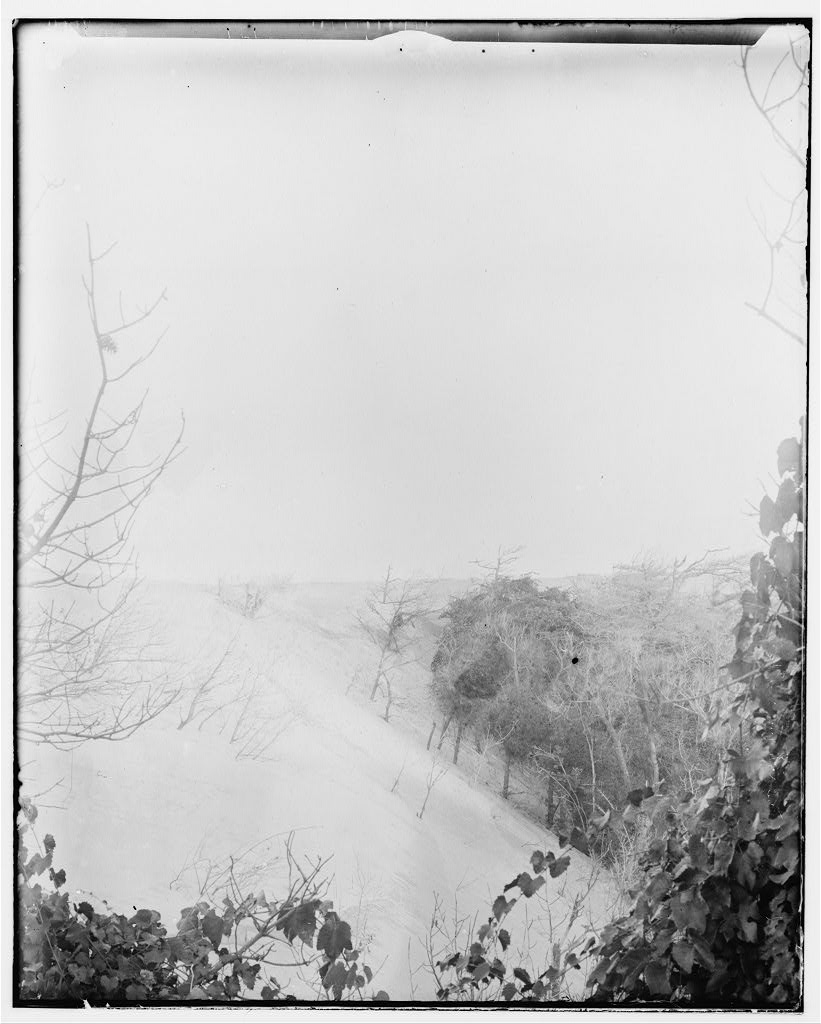
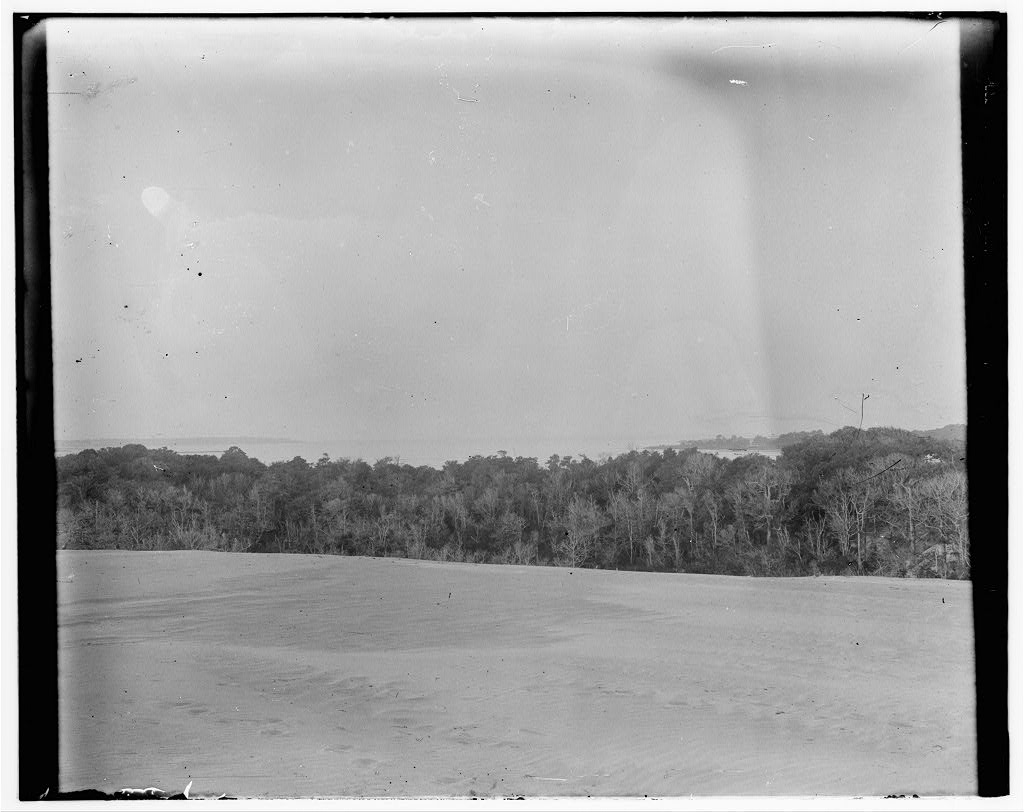
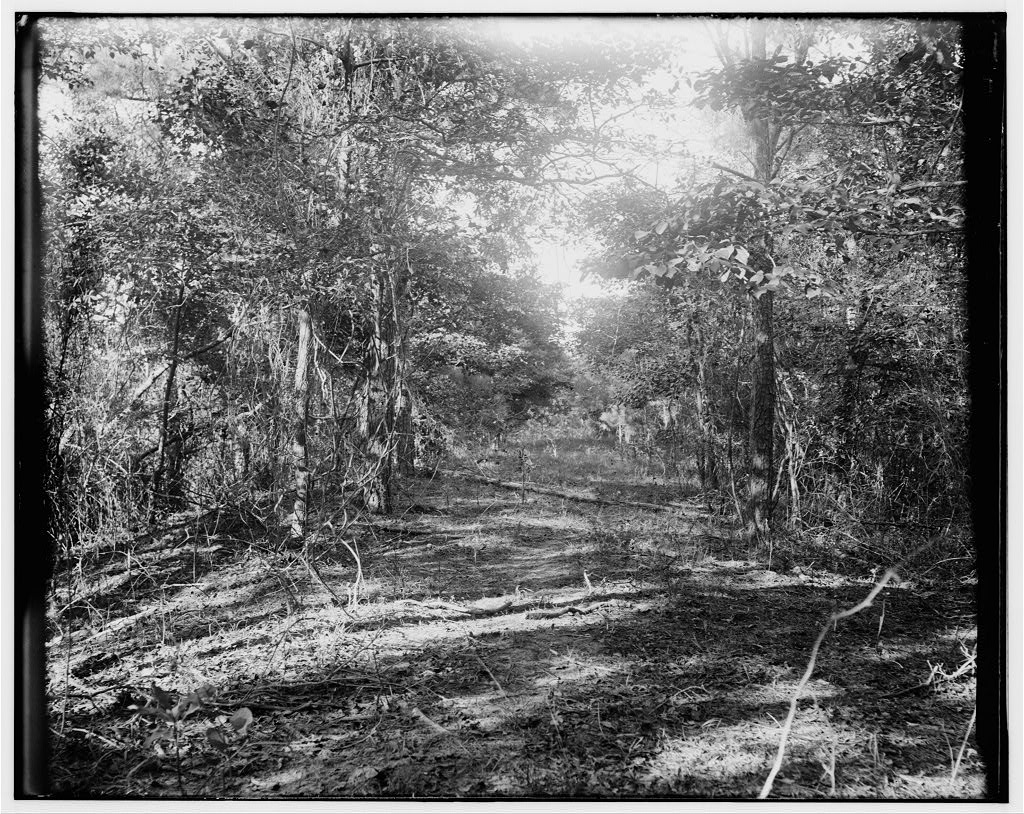
Wright brothers' photos 1900-1910 at Kitty Hawk
Trees taken over by dunes at Kitty Hawk 1900
More trees taken over by dunes at Kitty Hawk 1900
Trees were quite big at Kitty Hawk 1900
Woods at Kitty Hawk 1900
More of the Wright brothers' photos
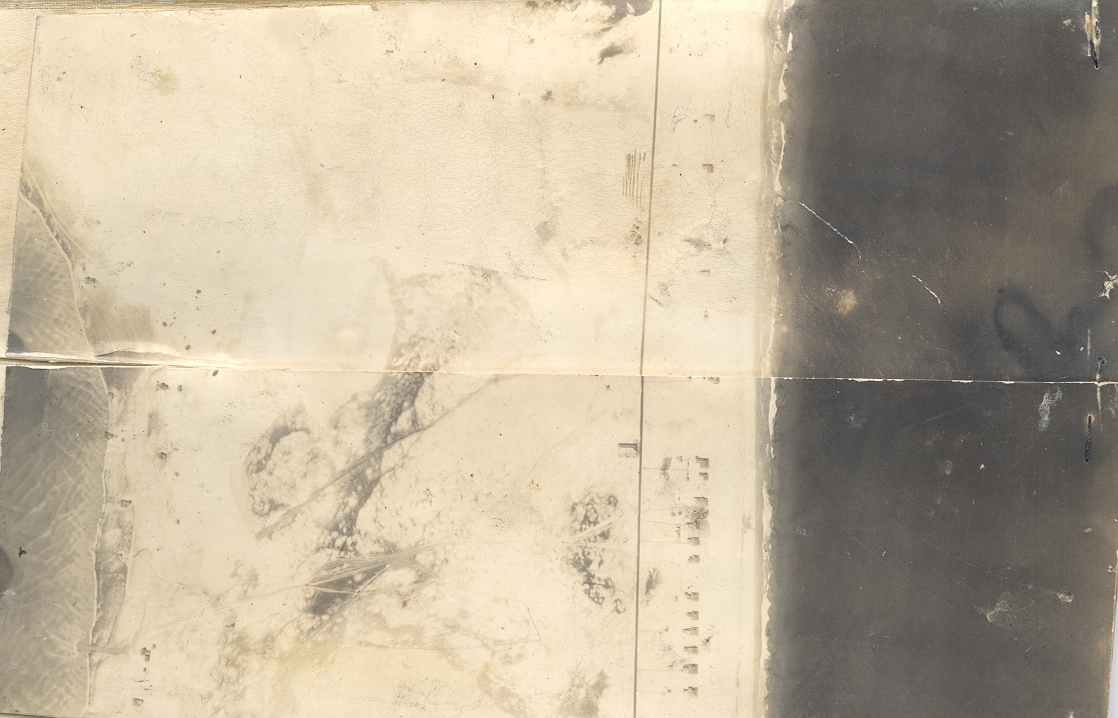
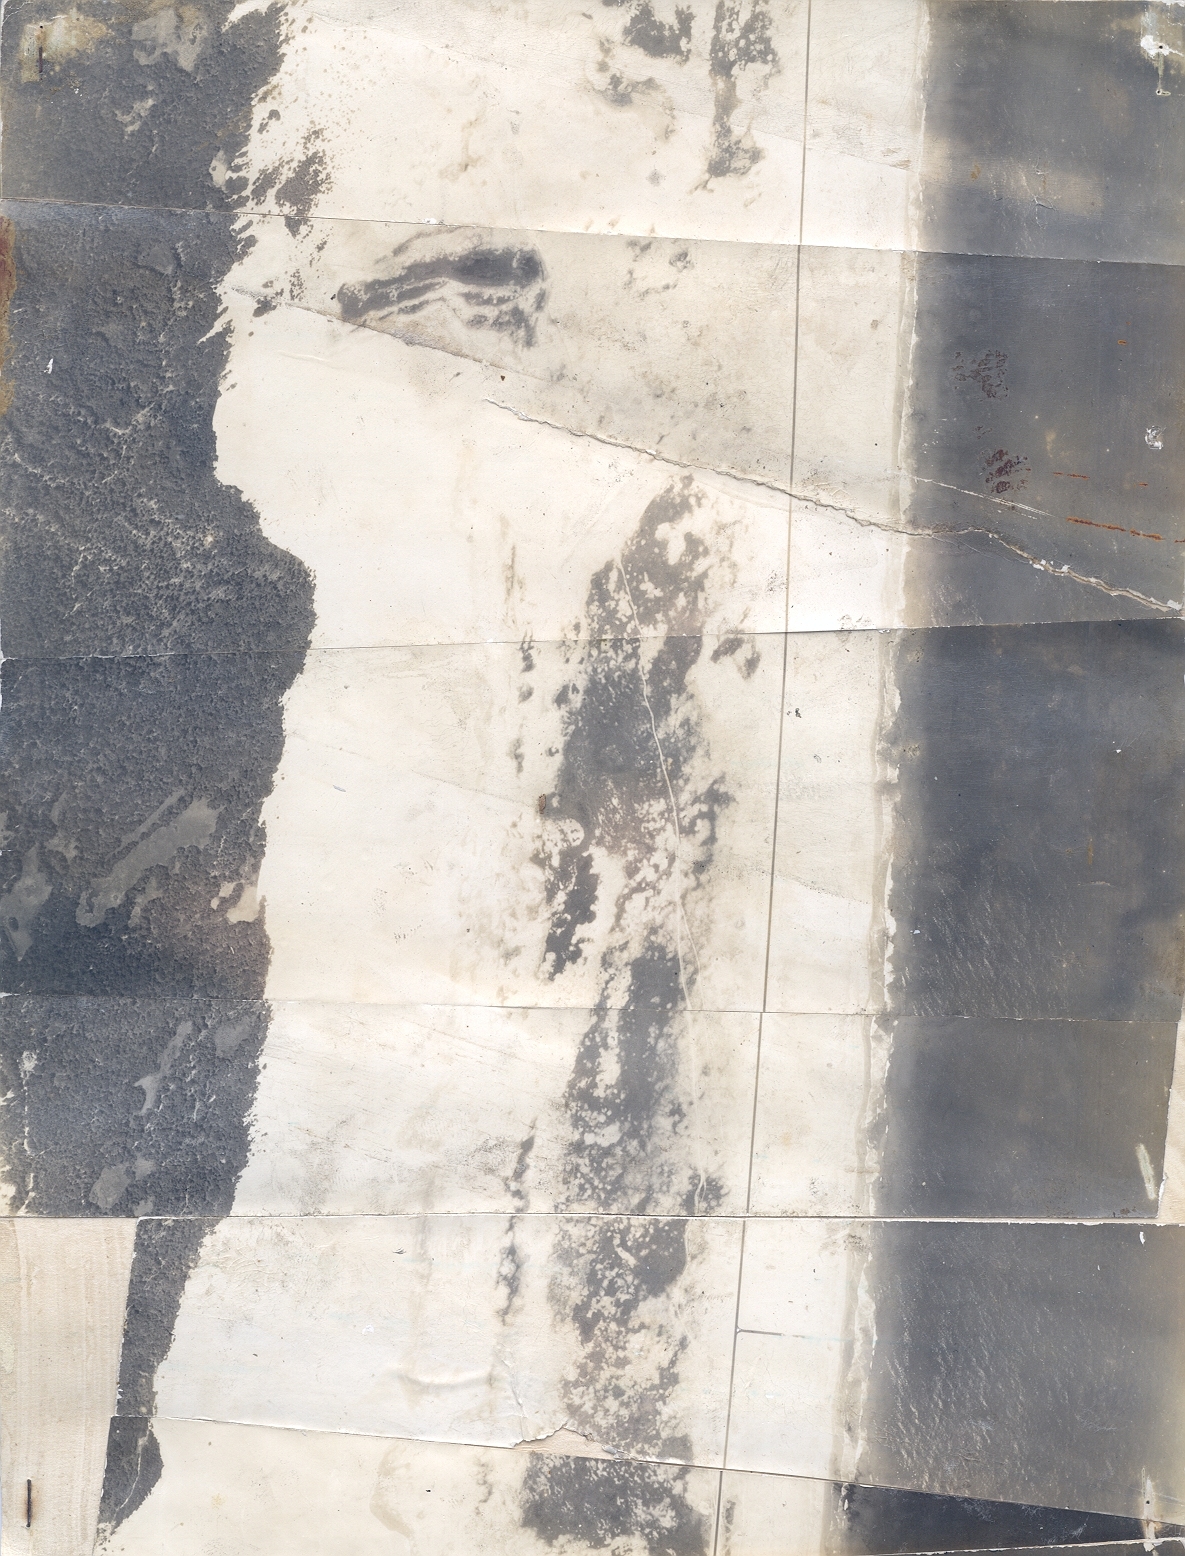
Aerial photo 1932 (courtesy USACE FRF Duck,NC)
Aerial photo 1932 north(courtesy USACE FRF Duck,NC)
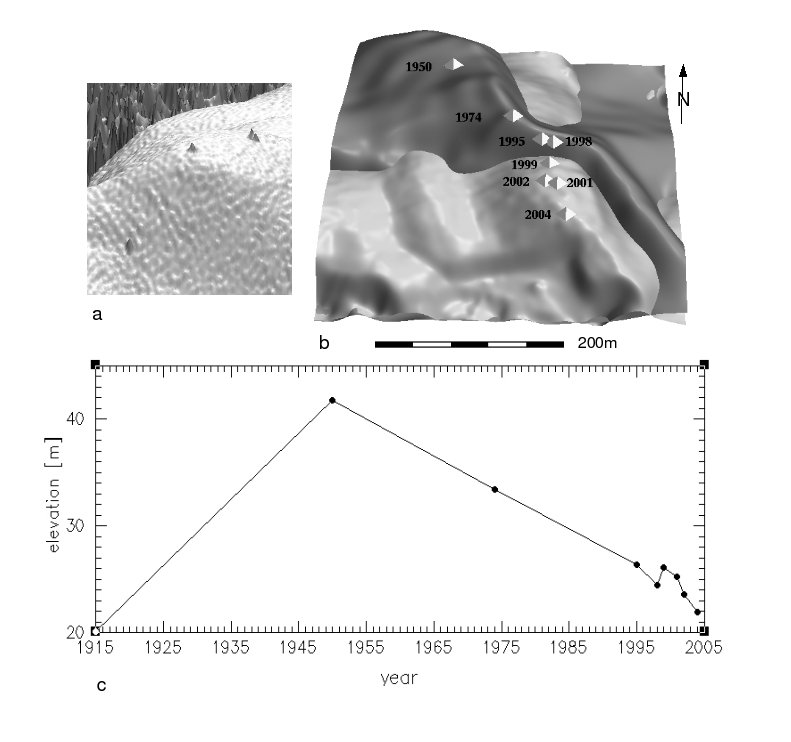 Figure 5. Peak migration
  Figure 10 Dune mnagement
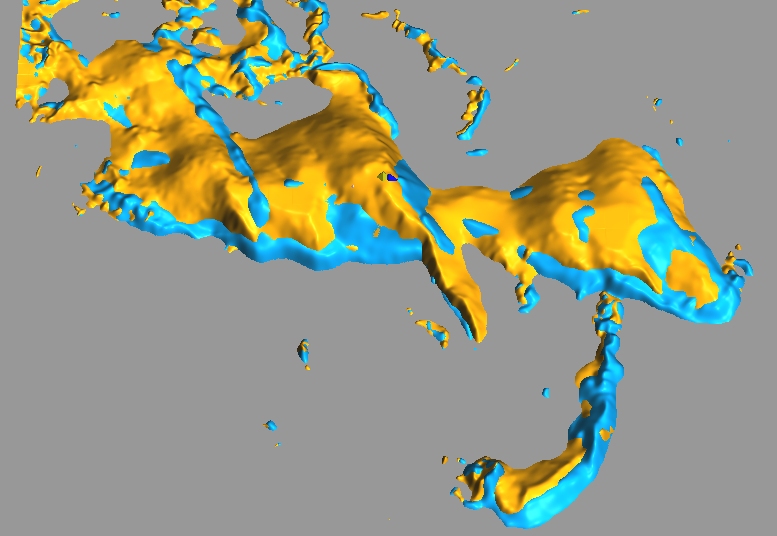 1995-1998
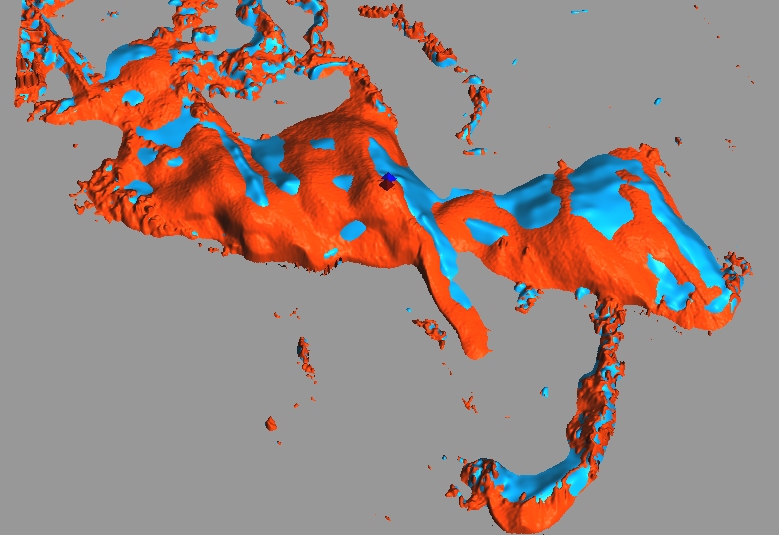 1998-1999
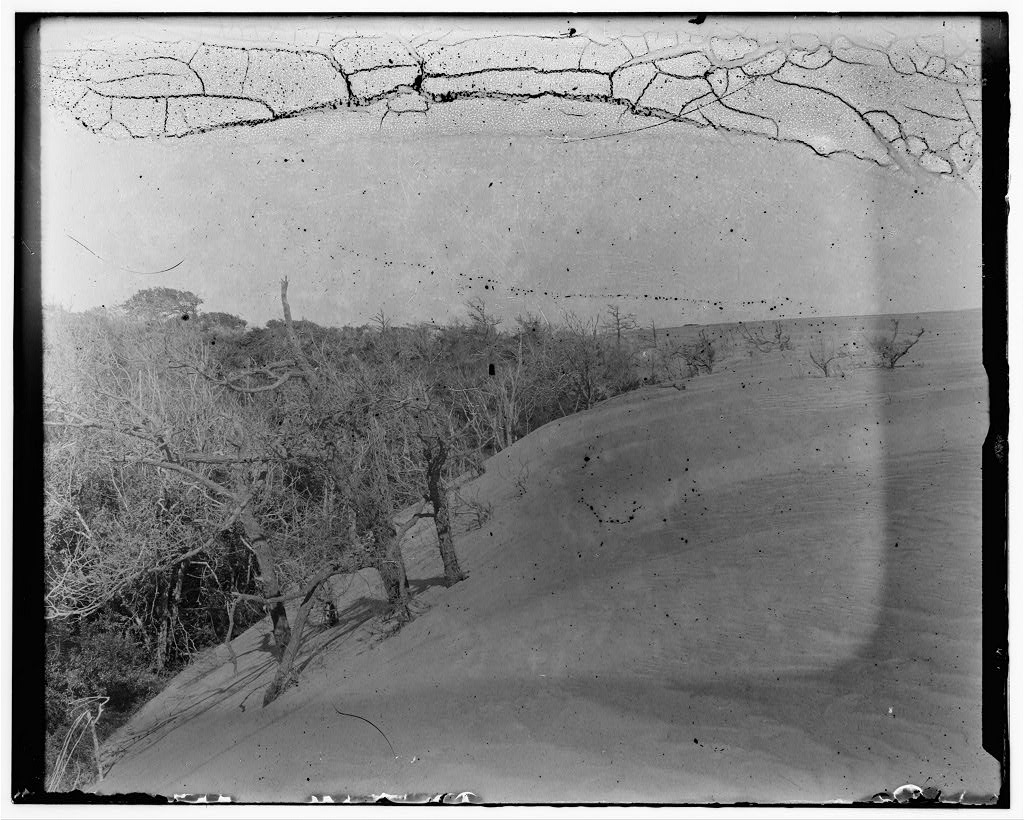