 GeoIS-EM Home
Bogue Island monitoring data processing
GeoIS-EM Home
Bogue Island monitoring data processing
GeoIS-EM Home
Bogue Island monitoring data processing
Helena Mitasova, NCSU
Chris Freeman, UNC, David Bernstein, CMWS CCU
GIS data processing is performed for the Bogue Island renourishment project:
a) stopped nourishment section May 2002
b) same section in August 2002
Data were imported into GRASS5 and interpolated at various resolutions using
s.surf.rst with tension (20,30,90 depending on the density of points which
was 15m,7m and 2m), smoothing 0.7 and anisotropy 0.2/10 deg. LIDAR data from 2000
were imported and compared with the current measurements.
Click on the image to get the full size.
Renourished beach 2002: comparison with 2000 LIDAR
a)Elevation in 2000 based on LIDAR b)Elevation in 2000 overlayed with elevation 2002 from RTK-GPS
Section without new sand
a) LIDAR surface overlayed with 2002 RTK survey - new sand is missing here and the
elevation surface is at 2000 level
b,c,d) Crossections comparing the 2000 (LIDAR) and 2002(RTKS) elevation, 10x exagerrated
elevation
High resolution (2m) comparison of small subarea
a) LIDAR 2000 elevation at 2m resolution
b) LIDAR 2000 (transparency) overlayed with RTK-GPS 2002 surface. Note that RTK data are
smoothed out too much - needs re-interpoltation with higher tension and less smoothing
c) RTK-GPS 2002 surface with slope draped as color shown with LIDAR 2000 transparent surface
Entire 38km beach: 20m resolution analysis
a) Elevation and sampling pattern. Diamonds mark the sections 1 through 12.
b) Slope showing three areas with increased nearshore slope (red: 4-5deg)
c) Profile curvature with 3 paralel convex lines: top of the beach and two sandbars
![[IMG]](bg20melzones.jpg)
![]() a
a
![[IMG]](bgslope20m.jpg)
![]() b
b
![[IMG]](bgpc20m.jpg)
![]() c
c
Renourished area A: 10m resolution analysis
a) Elevation
b) Slope and 0m contour shown as blue line
c) Slope with overlayed subarea studied at higher resolution in the next section
d) Profile curvature blue line is 0m contour, some "features" are subtle
interpolation artifacts
Beach at the steeper bathymetry area: 2m resolution analysis
a) Elevation
b) Slope and 0m contour shown as blue line
c) Elevation surface shown as block with color representing slope
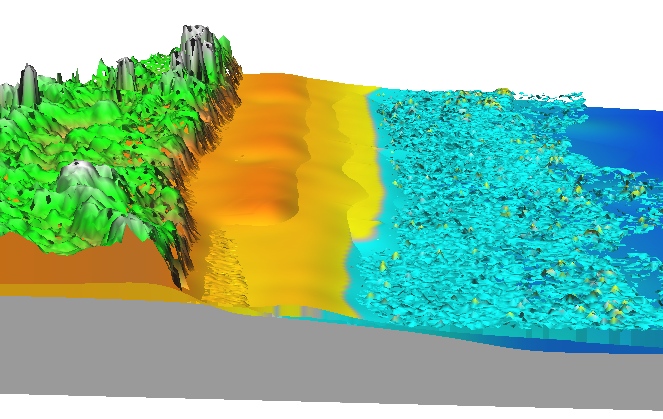
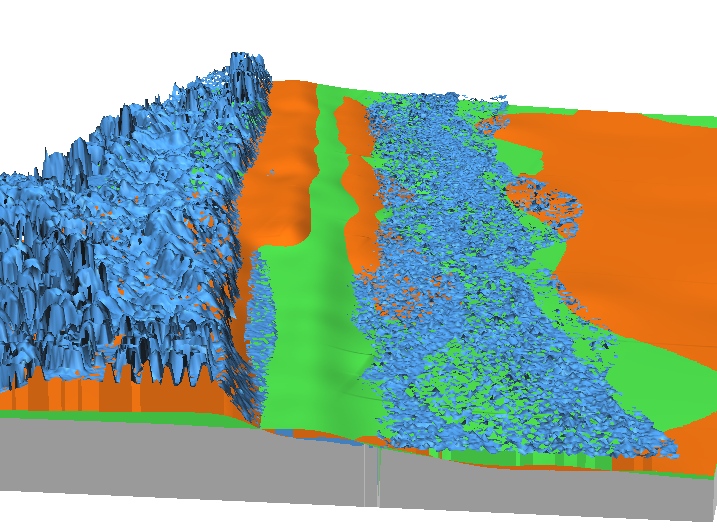
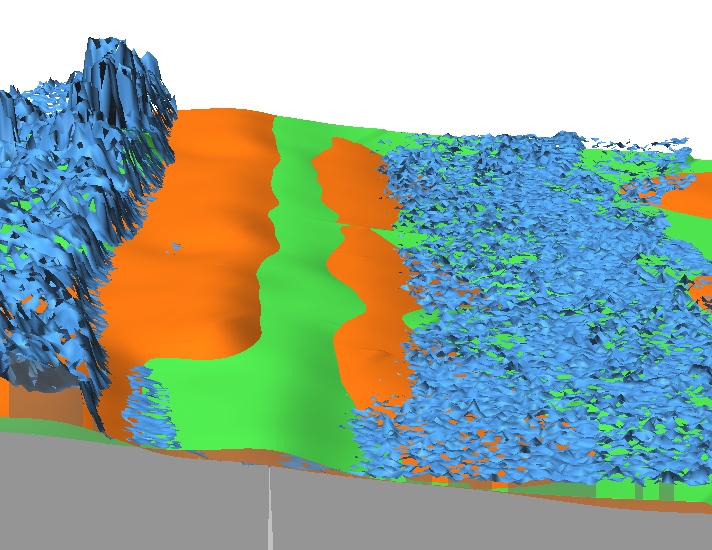
Preliminary results for May and August 2002 data
Overlayed elevation surfaces 2000 LIDAR and RTK-GPS May and August 2002, 2m resolution, in the disrupted nourishment area (see photo above)
In the next images, LIDAR is blue, May 2002 orange and August 2002 green
This project is supported by Army Research Office and National Research Council
![[IMG]](sumr_winds_May02.jpg) a
a![[IMG]](Sumr_winds_Aug_crop.jpg) b
b![[IMG]](bglid10mw.jpg) a
a![[IMG]](bglidrtk10mw.jpg) b
b![[IMG]](bglidrtksite10m.jpg) b
b![[IMG]](bghotspot210m.jpg) a
a![[IMG]](bghs1lidrtk10m.jpg) b
b![[IMG]](bghs2lidrtk10m.jpg) c
c![[IMG]](bghs3lidrtk10m.jpg) d
d![[IMG]](bglid2m.jpg) a
a![[IMG]](bglidrtk2mcuttr.jpg) b
b![[IMG]](bglidrtkslptr2mcut.jpg) c
c![[IMG]](bgel10m.jpg) a
a![[IMG]](bgslp10m0con.jpg) b
b![[IMG]](bgslp10m2m0c.jpg) c
c![[IMG]](bgpc10m.jpg) d
d![[IMG]](bgelev2m.jpg) a
a ![[IMG]](bgslope2m.jpg) b
b![[IMG]](bgblockslp2mb.jpg)
