3.2 Annual precipitation data from Slovakia
Long-term mean annual precipitation values (MAP) were obtained from 423 meteorological stations and from 12 storage gauges of the Slovak Hydrometeorological Institute network. Length of records was 30 years (1951-80) for all meteorological stations and for 4 storage gauges and 20 years (1961-80) for 8 storage gauges. The elevation data set was represented by digital elevation model of Slovakia with resolution 1x1 km (Fig. XX). For the cross-validation purposes we used digital interpretations of manually produced (expert) isoline maps of the MAP and evapotranspiration, as well as long-term mean annual runoff data from 57 gaged sites. The sites represent basins (Fig. XX) ranging in size from 40 to 3800 km2.

Fig. XX Overlay of precipitation stations and basin boundaries on digital elevation model of Slovakia
Table XX Characteristics of the manually contoured isoline maps
|
Factor |
Author |
Scale |
Period |
|
Precipitation |
Fasko |
1:750 000 |
1951-80 |
|
Evapotranspiration |
Tomlain |
1:1 000 000 |
1951-80 |
4.2 Annual precipitation (Slovakia)
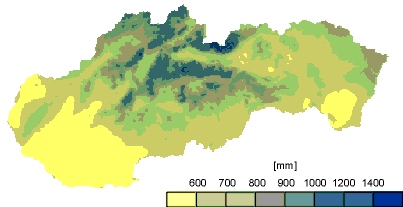
Resulted MAP precipitation grid map for Slovakia is presented in Figure XY. The precipitation estimates by TPS3D method show patterns fairly related to topography with minimum precipitation at lowlands and increasing MAP values in the mountains.

Fig. XY Grid map of TPS3D estimates of MAP.
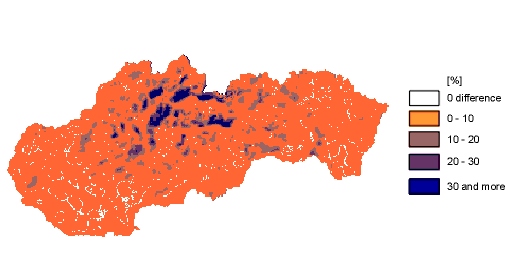
The spatial cross-consistency of resulted precipitation map has been investigated with respect to the digital interpretation of manual contoured precipitation (PMAN) map. Similar approach was chosen in Parajka (1999), where the cross-consistency between kriging, cokriging and PMAN maps has been evaluated. The difference between computed TPS3D map and the PMAN were expressed as grid map of absolute percentual differences (Fig. XY2) and frequencies of each category of difference were tabulated (Table XY).

Fig. XY2 Grid map of the absolute differences (in %) between the TPS3D precipitation map and PMAP - ((TPS3D-PMAP)/PMAP)*100.
Table XY Absolute percentual differences between grid precipitation maps constructed using TPS3D, kriging and cokriging methods (PRECIPMAP) and digital interpretation of expert-drawn isoline map (PMAP).
|
Area [%] of Slovakia |
Absolute % difference ((PRECIPMAP-PMAN)/PMAN)*100 |
|||
|
0% – 10% |
10% - 20% |
20% - 30% |
30% and more |
|
|
TPS3D |
87% |
7% |
2% |
2% |
|
KRIGING |
76% |
16% |
5% |
3% |
|
COKRIGING |
81% |
16% |
3% |
1% |
Table XY shows that TPS3D precipitation map is more similar to PMAP then kriging or cokriging estimates. The differences between TPS3D grid map and PMAP are at 87% of the territory of Slovakia within the range of 10%. The differences are observed in some mountainous regions with sparse observations, but there is questionable not only the accuracy of TPS3D estimates, but the accuracy of hand-drawn isoline map as well.
The cross-consistency have also been tested within the framework of hydrological balance. For each grid precipitation map – PMAP, TPS3D, kriging, cokriging - we constructed long-term mean annual runoff map using water balance equation (R=P-ET), where spatial representation of evapotranspiration was represented by digital interpretation of expert-drawn evapotranspiration map. The differences between computed basin averages of mean annual runoff and gaged runoff values for 57 basins were calculated and statistical comparison of these differences is listed in Table XY2.
Table XY2 Statistical evaluation of differences between runoff basin averages computed from water balance equation using different precipitation maps and measured runoff values
|
PMAP |
kriging |
cokriging |
tps3d |
|
|
Mean |
23 |
-67 |
-13 |
-15 |
|
Standard Error |
10.46 |
12.58 |
10.06 |
9.40 |
|
Standard Deviation |
78.94 |
94.98 |
75.97 |
70.93 |
|
Sample Variance |
6231.81 |
9021.30 |
5771.43 |
5031.72 |
|
Range |
483 |
421 |
400 |
356 |
|
Minimum |
-216 |
-356 |
-298 |
-239 |
|
Maximum |
267 |
64 |
102 |
117 |
|
Count |
57 |
57 |
57 |
57 |
The smallest range, as well as the lowest standard error and sample variance values of the average basin runoff differences presented in Table XY2 indicate, that average basin runoff values computed from TPS3D estimates come nearer to the measured values. In comparison with the other precipitation models (kriging, cokriging, PMAP), TPS3D model fulfils the best the balancing constraints of the hydrological balance equation.
The acceptable results of the cross-validation procedures demonstrate that TPS3D method offers repeatable and sufficiently accurate estimates of the MAP and could be used to describe the spatial variability of MAP over the territory of Slovakia.