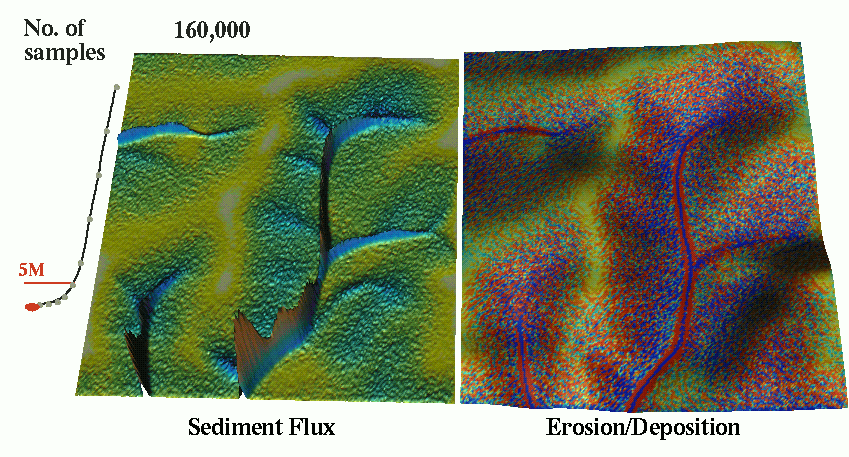
Figure 2 (animation). Path sampling solution of the continuity equation for sediment flow and net erosion/deposition using an increasing number of particles (from 7000 to 50 million)
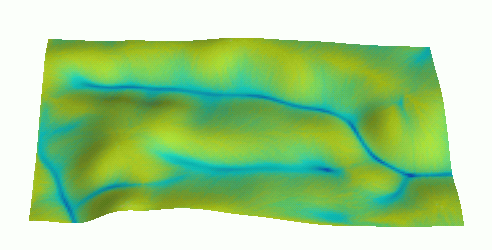
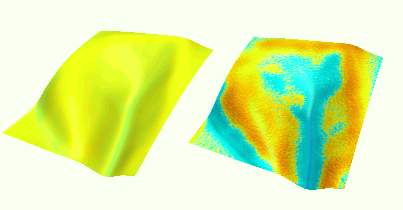
Figure 3 (animation). Evolution of water depth in a terrain with depression modeled by approximate 2D diffusive wave flow using the {\sl SIMWE} model.
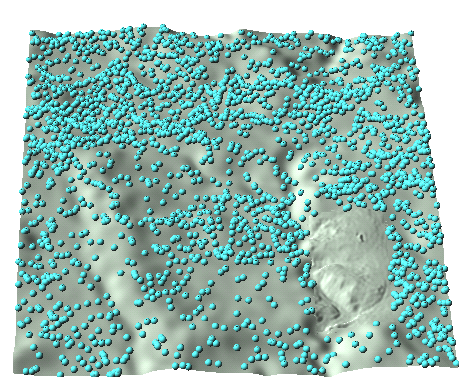
Figure 4 (animation). Evolution of multiscale path sampling solution for the water depth equation: particle representation.
Figure 5. Analysis of soil detachment and net erosion/deposition for Court Creek subwatershed for different land use alternatives estimated by RUSLE3D and USPED.
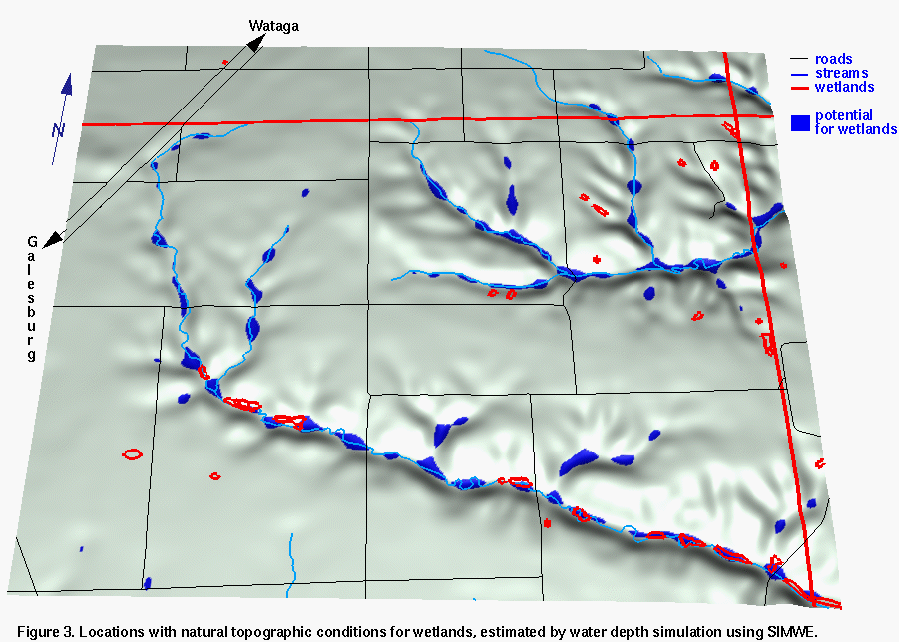
Figure 6. Map of topographic potential for wetlands.
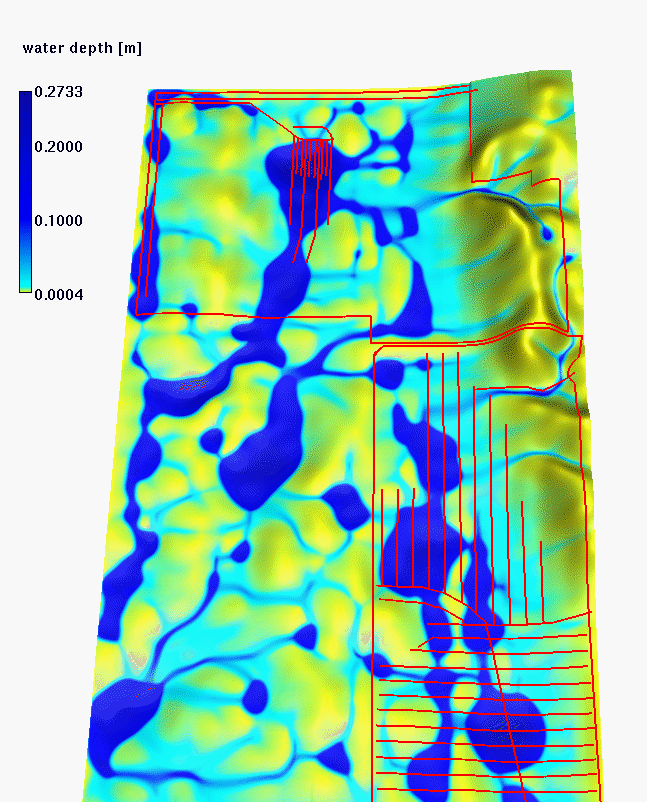
Figure 7. Simulated spatial distribution of water depth for agricultural fields (2.5x4.5km) draped as color over the DEM with the existing drainage drawn as red lines.
Figure 8.(animation) Evolution of water depth and net erosion/deposition pattern in an agricultural field for a sequence of events with increasing duration.
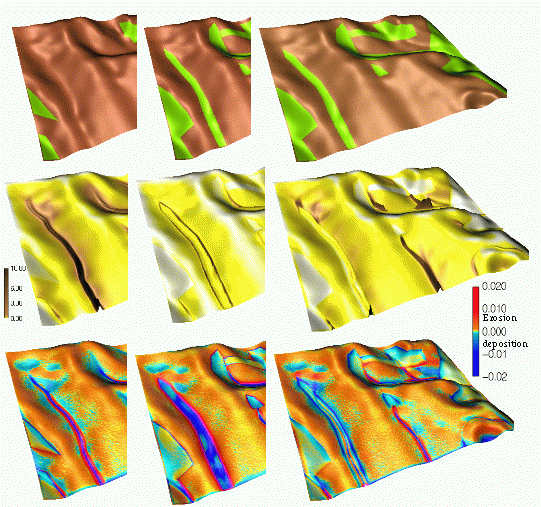
Figure 9. Impact of grassed waterway and differences in roughness on sediment flow and net erosion/deposition pattern: a) bare field with gully potential in the center, b) grassed waterway (light grey, n=0.1) and the bare field ( dark grey, n=0.01) with sediment flow along the grassed waterway (double channeling), c) grassed waterway (n=0.1) and the field with increased roughness (n=0.05) without increase in sediment flow along the waterway and smooth transition from erosion to deposition.