SG3d UPDATES
Documentation for new features specific to the latest
version of SG3d for Floating Point/Null Value GRASS, which
also incorporates a multiple attribute site format.
Floating Point/Null Value changes
All raster maps are now read as single precision floating point maps
for loading into SG3d. Null values are noted and when drawn, the surface
has gaps where there were NULLS, as in this
example image.
For backward compatibility, it is still possible to turn on "no zeros"
to prevent the drawing of the surface at zero data areas. MASKs should
work the same as they always have, since Floating Point GRASS reads
masked area as NULL.

Support for visualization of 3d point data in site lists
For visualization purposes, point data is often used to derive an
artificial surface or a volume from which isosurfaces may be calculated.
Such data extrapolation and interpolation is also necessary for modeling
purposes to produce input data for models that work with grids or volumes.
Better visualization of point data for comparison to derived surfaces at
various stages of the modeling process allows the researcher to
better understand and verify the model.
Building on recent improvements to the GIS library that work
intelligently with spatial site data containing multiple
attributes and more than two dimensions, visualization tools have
been improved to allow multiple attributes/dimensions
of point data to determine the shape, size, color and orientation of
solid 3d markers as well as the 3d position. Additional tools have
been developed to allow selection and display of a subset of sites
from a larger file based on ranges of values for various attributes
of each site. See also:
New GRASS Library Functions,
d.siter,
d.sites.qual,
s.info
Given a value for an attribute of the data at a particular site, visualization
is accomplished by mapping the value to one or more characteristics of the
marker.
For each data attribute, SG3d allows a transformation
consisting of an add_value and a multiply_value which converts the data
value to visualization units
(vis_value = (add_val + attribute_val) * mult_val).
In the case of color, three attributes (representing red, green, and
blue components) may be used to map a single characteristic, color by
selecting the Read RGB toggle button. SG3d expects
values in the range 0.0 to 1.0 to represent color when using this
option. If a single identifier is entered in the fields:
entry box, then a grey shade will be calculated from the attribute,
otherwise three identifiers must be entered to specify which attributes
should represent the red, green, and blue components of color, respectively.
If Use category or Use value for color
are selected, the existing GRASS color
lookup functions are used for the transformed value, according to the
color table as represented by a specified color (raster) file.
GRASS only provides color lookup for raster data so you may
have to create an empty raster unless you can use a color table from
an existing raster.
The characteristic of
variable shape is accomplished by having an "alternative" size field which
is used to scale the marker vertically.
"Info" button:
Selecting "Info" prints to the text window a summary of what
attribute fields, categories, dimensions, and string fields are present in
the current sites file. Labels are printed for each field if present
and attribute fields are numbered in the order they exist in the file.
This is the number you would use to identify the field for
use in visualization (see below).
Identifying site data elements to SG3d:
On the new sites panel,
for each visual characteristic of the marker there are text entry fields
to identify which site field you want to use for that characteristic.
Legal values for this entry are:
- The numbers 1-N, where N
is the number of double precision site attributes present.
- The letters n,N,s,S,y,Y which all represent the northing coordinate
- The letters e,E,w,W,x,X which all represent the easting coordinate.
- The letters z,Z which both represent the 3rd dimension.
To use a category value instead of an attribute, choose "Use category"

Support for custom labeling of 3d point data in site lists
The new label panel includes the capability to automatically extract
and place labels from a sites file. In addition, a set of proportion
values from the sites file may be used to generate piechart labels for
each site. Labelling is performed by selecting the type of label
desired and then selecting the Label Sites button.
The in box check box applies to any of the site
labels - it will draw a grey-shaded box which contrasts to the color
chosen for the label before writing the label within the box, ensuring
legibility of the label. Any combination of category, string, or
value information may be used for the label. The label string will
be created using first any category information (if the
category checkbox is selected), then any string information
(if the strings checkbox is selected), then any
double attribute information (if the values
checkbox is selected). Multiple fields may be requested in arbitrary
order by entering text in the fields: entry box
such as:
- 1 2 (fields 1,2)
- 1,2 (fields 1,2)
- 3-1,4 (fields 3,2,1,4)
- N,2 1 (northing, then fields 2,1)
Commas or spaces may be used to separate field identifiers.
When written to the label string, multiple fields are separated by spaces.
The number in the precision entry box specifies
how many decimal places to display when using double precision attributes
as labels.
 Using the format described above, multiple fields may be specified in
the fields: entry box with the piechart
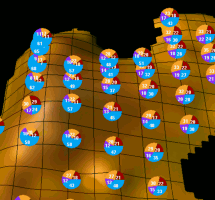
box checked to produce piechart labels such as those in
the example (click on image for larger image), which was drawn
using settings as indicated by
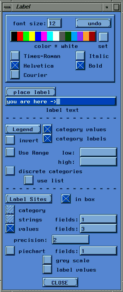
this image of the panel.
Colors for the pie wedges are selected by using the "custom" colors
from the color bar, in reverse order (right to left), then proceeding
with the constant colors from the color bar if there are more than 5
ratio fields. Therefore, to change the colors, edit the "custom"
colors by selecting set (next to the color bar).
Size of the piechart probably ought to be controlled by setting
font size, but instead it is currently implemented so that you must
use the size slider on the Sites
panel. Settings at the top of the Label panel
are used to determine font size and color for all labels, including
those used to label pie wedges when label values
is selected. Double precision values in the sites file used to
generate piecharts should range from 0.0 - 1.0 and the sum of those
used should not be greater than 1.0.
Note that precision does not affect the
wedge labels; they are always rounded to the nearest whole percent.
Site labels are not drawn for sites which would
lie on a masked portion of the surface.
 Using the format described above, multiple fields may be specified in
the fields: entry box with the piechart
box checked to produce piechart labels such as those in
the example (click on image for larger image), which was drawn
using settings as indicated by
this image of the panel.
Colors for the pie wedges are selected by using the "custom" colors
from the color bar, in reverse order (right to left), then proceeding
with the constant colors from the color bar if there are more than 5
ratio fields. Therefore, to change the colors, edit the "custom"
colors by selecting set (next to the color bar).
Size of the piechart probably ought to be controlled by setting
font size, but instead it is currently implemented so that you must
use the size slider on the Sites
panel. Settings at the top of the Label panel
are used to determine font size and color for all labels, including
those used to label pie wedges when label values
is selected. Double precision values in the sites file used to
generate piecharts should range from 0.0 - 1.0 and the sum of those
used should not be greater than 1.0.
Note that precision does not affect the
wedge labels; they are always rounded to the nearest whole percent.

