Table 1. Examples of landscape phenomena visualization using point symbols, dynamic surfaces and isosurfaces. Click on the image to retrieve a full size picture (approx. size 50-150K), or animation (approx. size 50-200K)

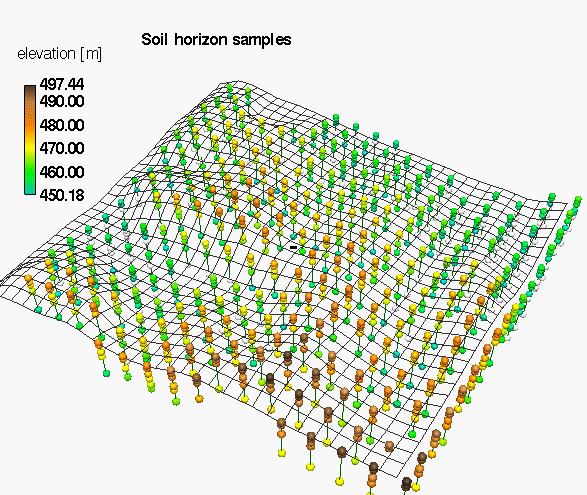
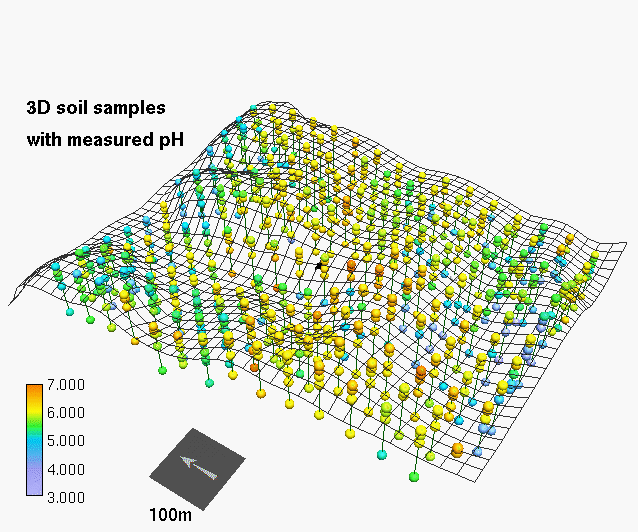
Visualization of landscape characterization data as multi-variate fields modeled by bi-, tri-, and quad-variate Regularized Spline with Tension
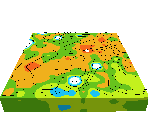
phenomenon (field) point data 3D dynamic map
elevation: z=f(x,y);
single surface
precipitation: pi=fi(x,y); i=1,...,12;
time series of surfaces
soil horizons: zi=fi(x,y); i=1,...,5;
vertical series of surfaces
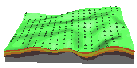
soil pH: pH=f(x,y,z);
single volume
concentrations of nitrogen in water: w=f(x,y,z,t);
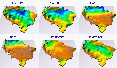
volume evolving in time (jan-dec)