 Figure 1.
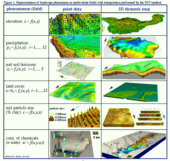
Representation of landscape phenomena as multivariate fields with
interpolation using RST method. Figure 1.
Representation of landscape phenomena as multivariate fields with
interpolation using RST method.
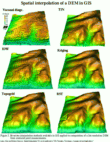 Figure 2.
Spatial interpolation methods available in GIS for DEM construction. Figure 2.
Spatial interpolation methods available in GIS for DEM construction.
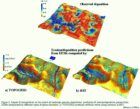 Figure 3.
Impact of interpolation on the results of landscape process simulations. Figure 3.
Impact of interpolation on the results of landscape process simulations.
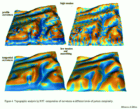 Figure 4.
Topographic analysis of curvatures by RST. Figure 4.
Topographic analysis of curvatures by RST.
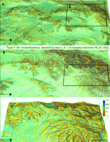 Figure 5.
Net erosion/deposition at various resolutions. Figure 5.
Net erosion/deposition at various resolutions.
|
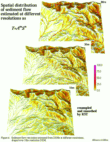 Figure 6.
Spatial distribution of sediment flow estimated at different resolutions. Figure 6.
Spatial distribution of sediment flow estimated at different resolutions.
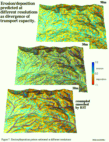 Figure 7.
Spatial distribution of erosion/deposition estimated at different resolutions. Figure 7.
Spatial distribution of erosion/deposition estimated at different resolutions.
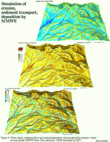 Figure 8.
Water depth, sediment flow, and erosion/deposition rates predicted by SIMWE. Figure 8.
Water depth, sediment flow, and erosion/deposition rates predicted by SIMWE.
 Figure 9.
Volume models of soil properties interpolated from point data. Figure 9.
Volume models of soil properties interpolated from point data.
|
 Figure 1.
Representation of landscape phenomena as multivariate fields with
interpolation using RST method.
 Figure 6.
Spatial distribution of sediment flow estimated at different resolutions.
 GMSL Modeling & Visualization Home Page
 Figure 2.
 Figure 3.
 Figure 4.
 Figure 5.
 Figure 7.
 Figure 8.
 Figure 9.