

 a
a
 b
b
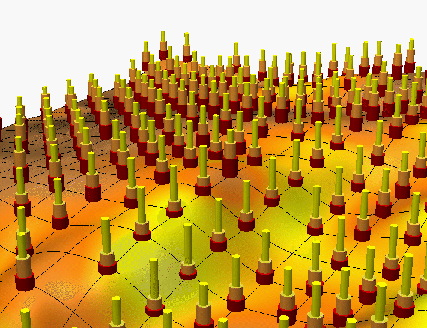
a) Multi-attribute soil texture data displayed
using symbols sized and colored according
to the attributes (% sand, silt and clay).
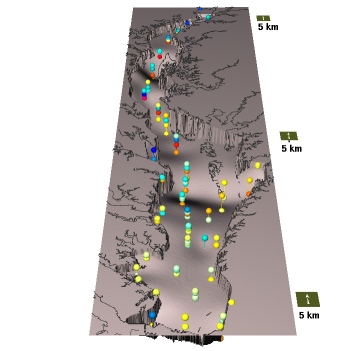
b) 3D nitrogen data colored according to the predictive error of
4D RST interpolation
Helena Mitasova, NCSU